
HOMER Pro 3.16

There are several reasons to perform a sensitivity analysis by entering multiple values for a particular input variable. First, you might not know the exact value of a variable. By specifying a range of values, you can determine how important that variable is, and how the solution changes depending on its value. In other words, you can determine how "sensitive" the outputs are to changes in that variable.
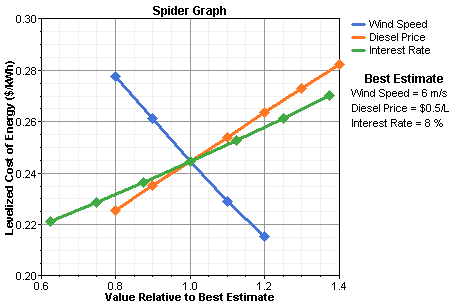
For example, a modeler doing a preliminary analysis of a wind-diesel system is uncertain about three variables: the annual average wind speed, the average fuel price over the life of the project, and the interest rate. To determine the sensitivity of the system's cost of energy to those three variables, the modeler performs a sensitivity analysis using HOMER. Her best estimate for the wind speed is 6 m/s; for the fuel price, $0.50/L; and for the discount rate, 8%. She enters multiple values for each variable, covering the range of uncertainty of each (by entering "0%" for the Expected Inflation Rate, the Nominal Discount Rate input maps directly to the Real Discount Rate). HOMER produces the Spider Graph below, showing that the cost of energy is most sensitive to the wind speed (the wind speed line is the steepest). As a result, the modeler chooses to invest more time and money to obtain a more accurate estimate of the wind speed.
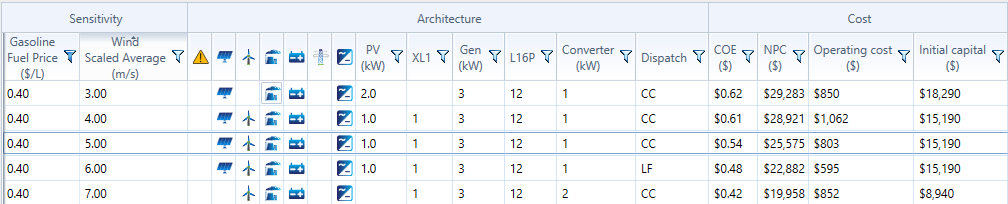
Another reason for performing a sensitivity analysis is to make a single analysis applicable to more than one installation. For example, imagine you are designing small renewable power systems for six telecommunication sites. If the sites are similar in most respects but there is some variation in wind speed from one site to another, you can specify several wind speeds spanning the appropriate range. Then a single analysis is sufficient to design all six hybrid systems. The results of such an analysis might look like the example below, where HOMER has suggested a PV/storage/generator system for the site with the lowest wind speed, wind/PV/storage/generator systems for the sites with higher wind speeds, and a wind/storage/generator system for the highest wind speed.
See also
