
HOMER Pro 3.16

![]()
Important: This option is part of the Hydro module. See Adding Modules for more information on purchasing modules.
Use the Hydro Resource page to describe the stream flow available to the hydro turbine. HOMER uses this data to calculate the output of the hydro turbine in each time step.
Click the Hydro button under the Resources tab in the toolbar at the top of the page. The Hydro Resource page appears.
Choose Hydro Data Source
The baseline data is a one-year time series representing the average stream flow, expressed in liters per second, for each time step of the year. HOMER displays the monthly averages calculated from the baseline data in the Monthly Average Stream Flow Data table and graph.
There are two ways to create baseline data: you can use HOMER to synthesize hourly data, or you can import time series data from a file.
Click either the Enter monthly averages radio button or the Import from a time series data file or the library radio button.
Enter Monthly Averages
To synthesize data, you must enter twelve average stream flow values: one for each month of the year. Enter each month's average stream flow (L/s) in the appropriate row on the stream flow table. As you enter values in the table, HOMER builds a set of 8,760 values, or one stream flow value for each hour of the year. HOMER creates the synthesized values by assuming that the stream flow is constant throughout each month; HOMER assigns the monthly average value to each hour in that month.
Import Stream Flow Data
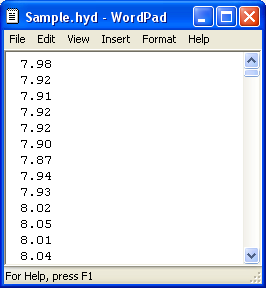
To import a file, you must prepare a text file that contains the stream flow in each time step for a complete year.
Tip: You can import data with any time step down to one minute. HOMER detects the time step when you import the data file. For example, if the data file contains 8760 lines, HOMER assumes it contains hourly data. If the data file contains 52,560 lines, HOMER assumes it contains 10-minute data.
The data file must contain a single value on each line, corresponding to one time step. Each value in the file represents the average stream flow (in L/s) for that time step. The first time step starts at midnight on January 1st. The following is a sample input file.
Click the Import button or the Import and Edit button to open the text file. You can import a text file with any extension.
When you import data from a text file, HOMER makes a copy of the data set and integrates it with the HOMER (.homer) file. After the data is part of the HOMER file, HOMER no longer refers to the original text file. If you modify data in the original file, you must import the modified file in order for the modification to be included in the HOMER file. After you import a data file, HOMER calculates twelve monthly average stream flow values and displays them in the table and graph. HOMER also displays the name of the imported data file in the title of the stream flow graph.
If you click the Enter monthly averages radio button after importing data from a file, HOMER discards the data from the imported file and synthesizes new data based on the twelve monthly average values it calculated from the imported data. You can edit synthesized data by changing values in the stream flow table. To edit values from an imported file, you must edit the file directly and then import the modified file, as described above.
Scaled Data for Simulation
HOMER uses scaled data for calculations. To create scaled data, HOMER multiplies each of the baseline data values by a common factor that results in an annual average value equal to the value that you specify in the Scaled Annual Average box.
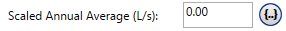
To determine the value of this factor, HOMER divides the Scaled Annual Average by the baseline annual average. The scaled data retains the shape and statistical characteristics of the baseline data, but may differ in magnitude. The default value for the scaled annual average is the baseline annual average. When the two values are equal, the scaled data and baseline are identical. HOMER interprets a Scaled Annual Average of zero to mean that there is no stream flow.
Two reasons to use a different Scaled Annual Average than the baseline annual average are for unit conversion and sensitivity analysis.
An example of using the Scaled Annual Average for unit conversion is to convert data from an imported file that contains stream flow data expressed in US gallons per minute. If the baseline annual average is 90 gal/min, enter 5.68 in Scaled Annual Average, so the scaled data is equivalent to the baseline data, but expressed in L/s rather than U.S. gallons per hour: 1 L/s = 15.85 gal/min; 5.68 L/s = 90 gal/min.
Another reason to scale the baseline data is to do a sensitivity analysis on the Hydro Resource. Click the sensitivities button (to the right of the text box) to enter multiple values for a sensitivity analysis.
The Plot button allows you to view the scaled data in several graphical formats.
See also
