
| Turbulence Detrending Window | |
This feature is coming soon to Windographer 5.
This window allows you to explore the application of, and the effects of, the Larsen & Hansen turbulence detrending algorithm. To access it, choose from the menu.
Note: The Turbulence Detrending menu option is only available if the current data set contains at least one wind speed data column that has a corresponding standard deviation column or an associated turbulence intensity column.
The drop-down box at the top left corner lists the visible speed sensors that have corresponding standard deviation columns, and therefore turbulence intensity columns. If the wind speed data column you are looking for does not appear in this drop-down box, you must return to the Configure Dataset window and associate a standard deviation column with that wind speed data column. Also check that the wind speed data column is visible.
Below the drop-down box a table shows, for the speed sensor that you choose, the mean and standard deviation in each of three time steps: the central time step, which is the one for which it calculates the detrended turbulence, and the time steps immediately before and after.
A graph shows the three measured wind speeds along with the trendline calculated by the Larsen & Hansen algorithm. The trendline is a spline-like curve covering the three-time-step interval, consisting of a third-order polynomial curve in each time step, with the curves' averages, slopes, and second derivatives matching at the time step boundaries. The average value of the trendline in each time step matches the observed mean in that time step.
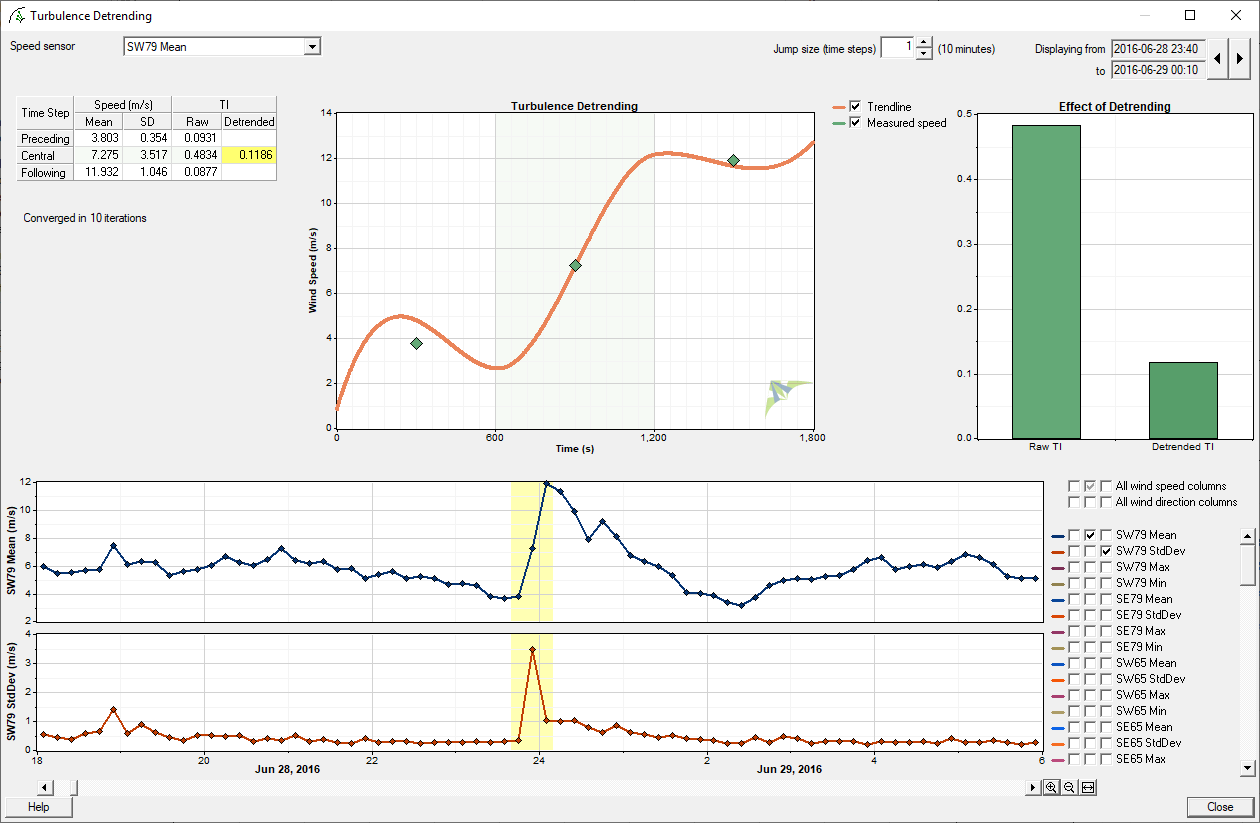
The algorithm assumes that the measured standard deviation in the central time step results partly from this relatively long-term trend, and partly from the high-frequency ocillations superimposed upon it. Having deduced the trendline, the algorithm can determine the trendline's contribution to the observed standard deviation, and it subtracts that to find the standard deviation due to the high-frequency fluctuations alone. Dividing that by the mean wind speed in the central time step produces the detrended TI value.
Tip: In the Configure Dataset window you can modify the properties of any calculated TI data column and specify that you want to apply the Larsen & Hansen detrending algorithm to that data column.
See also
Turbulence intensity calculated column
Larsen & Handsen turbulence detrending algorithm