
| Distribution Error | |
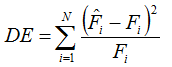
The distribution error (DE) is a measure of how closely the distribution of a set of predicted values matches the distribution of the observed or true values. To calculate the distribution error, Windographer constructs two frequency distributions, one for the predicted values and one for the observed values, making sure the two distributions have the same number and size of bins. Then it computes the DE as the Pearson's chi-squared test statistic, using the following equation:
where: | ||
| N | is the number of bins in the frequency distribution | |
 | is the frequency of the ith bin of the true distribution | |
 | is the frequency of the ith bin of the predicted distribution |
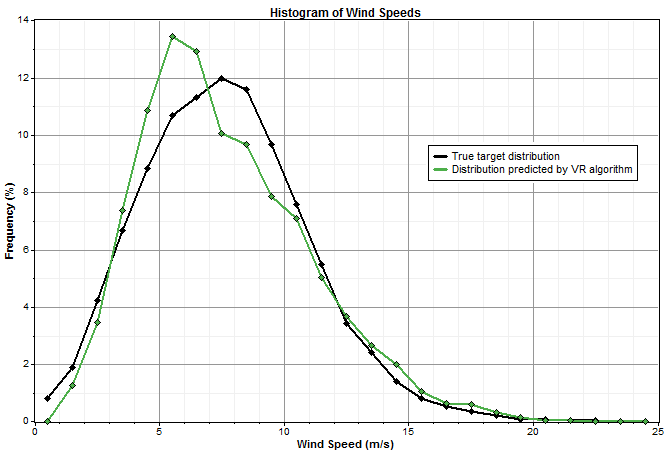
The more closely the predicted distribution fits the actual distribution, the smaller the distribution error. Take the two graphs below for example. The first compares the true target distribution with the distribution predicted by the Variance Ratio (VR) algorithm:
The second compares that same true target distribution with the distribution predicted by the Matrix Time Series (MTS) algorithm:
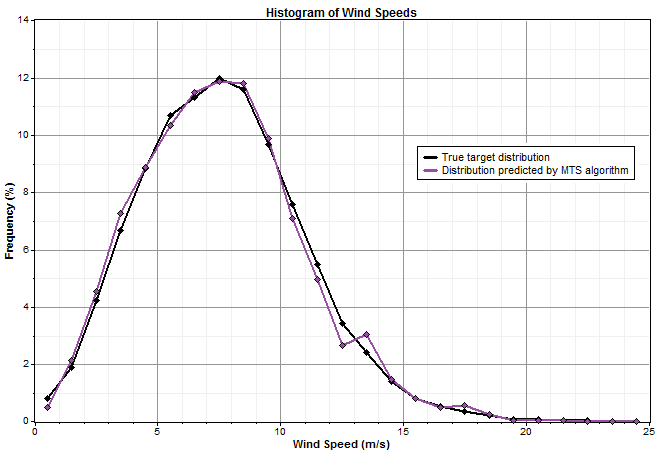
In that example, the MTS algorithm fits the true distribution more closely than the VR algorithm, so it will have the lower distribution error.
See also
Mean Absolute Error definition
Root Mean Squared Error definition
Algorithm Performance Test window