| Harris 1996 Algorithm for Gumbel Fitting |  |
The Harris 1996 algorithm for fitting the Gumbel distribution is described in Harris, 1996. That paper introduced several modifications to the simple approach to fitting the parameters of the Gumbel distribution, including a swapping of the x and y axes, an adjustment to the plotting positions, and the use of a weighted least squares procedure rather than the classic unweighted least squares procedure. It also recommended the fitting of the Gumbel distribution to the square of the wind speeds values, rather than the wind speeds themselves, to improve the quality of the curve fit.
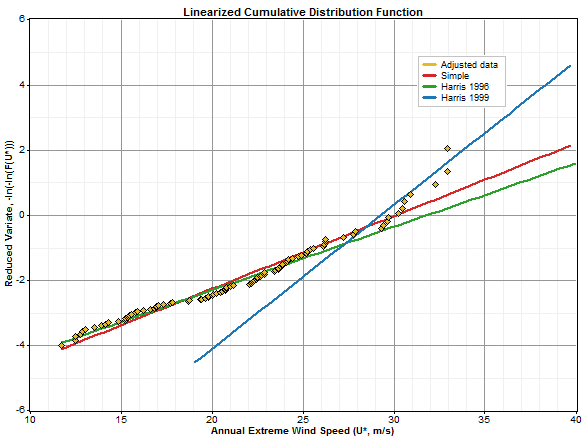
These adjustments typically lead to modestly different results than the Simple Gumbel algorithm. The graph below, for example, shows 92 monthly peak wind speeds along with the Gumbel distributions resulting from the Harris 1996 algorithm, the Simple algorithm, and the Harris 1999 algorithm:

The Periodic Maxima tab of the Extreme Wind window implements the Harris 1996 algorithm, and it is one of the algorithms you can use on the Extreme Wind Tool window.
The Harris algorithms operate on so-called "annualized" probabilities, meaning probabilities that represent the chance of experiencing a certain peak wind speed in a given year. However, extreme wind probabilities obtained from your data are generally not annualized; instead, they represent the probability of experiencing a given extreme wind speed in a given period of fixed size, or during a given storm event (for the Method of Independent Storms). Windographer annualizes these probabilities by raising them to the power of r, where r is the average number of periods or storms per year. This means that the annualized probabilities can sometimes be extremely small for all but the largest of the extreme wind speeds, especially if the value of r is large (i.e. if your periods or storm events are very short).
Another concept related to the Harris Gumbel fitting algorithms is that of the "adjusted" plotting positions. Windographer can show both the original and adjusted plotting positions in the Extreme Wind Analysis and Extreme Wind Tool windows. The original plotting positions are simply the CDF probabilities for your extreme wind speeds that have been transformed according to y' = -ln(-ln(y)). This transformation linearizes the form of the Gumbel distribution expression so that the Gumbel curve parameters can be obtained from a linear curve fit. However, before this curve fit is performed, these plotting positions are adjusted according to a method defined by Harris, in order to adjust for statistical anomalies introduced by various factors (e.g. the linearization process itself). For more detail on these adjustments and their statistical justification, see Harris, 1996 and 1999.
See also
Simple algorithm for Gumbel fitting