
HOMER Pro 3.16

![]()
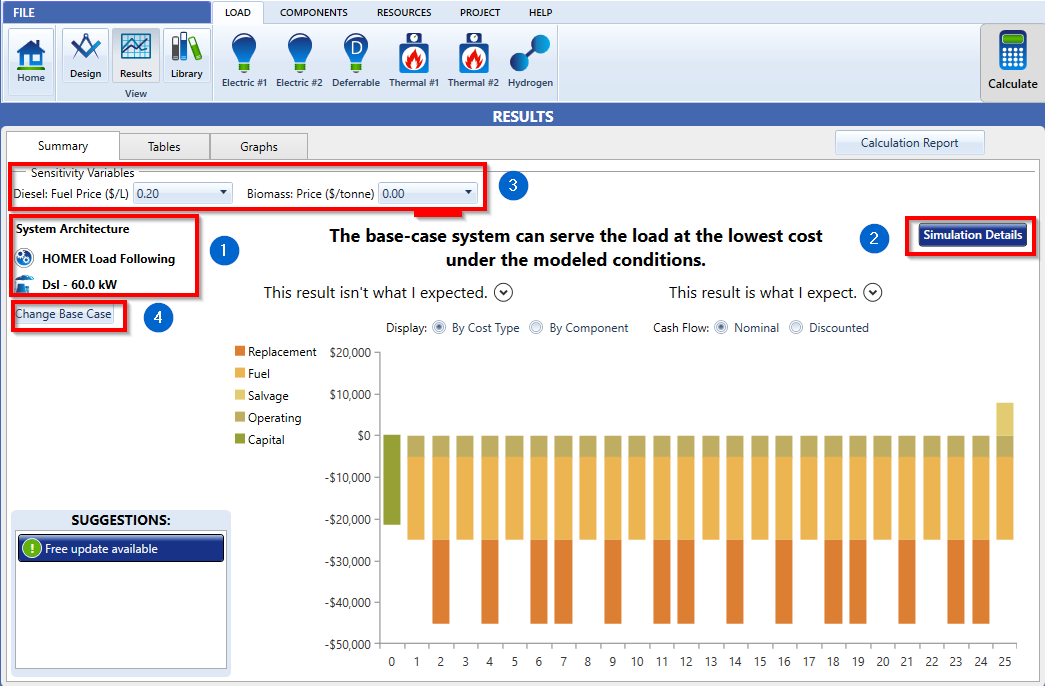
The image provided below is an example of how the summary tab looks when the base case wins. The sections numbered in the image are described in the table below.
Section |
Variable |
Description |
1 |
System Architecture |
This section shows the architecture of the base case (and in this case the winning system). |
2 |
Simulation Details |
This button gives you access to the simulation details of the winning system – cash-flow, time-series etc. This is a short-cut to the simulation results for the lowest NPC system, which you can also access from the ‘Tables’ tab. |
3 |
Sensitivity Variables |
This section lists the sensitivities in the HOMER model. If you have no sensitivities, then this section is blank. The winning system and the base case are for the sensitivity currently selected. |
4 |
Change Base Case |
This button allows you to change the base case by clicking on the “Change Base Case” button. |
This result isn’t what I expected
If you did not expect the utility only system to be the winning system with the lowest NPC, then here are a few things you could do.
1.Check your inputs. If the hybrid system is more expensive or infeasible check the costs inputs to your model, and the size of the hybrid components.
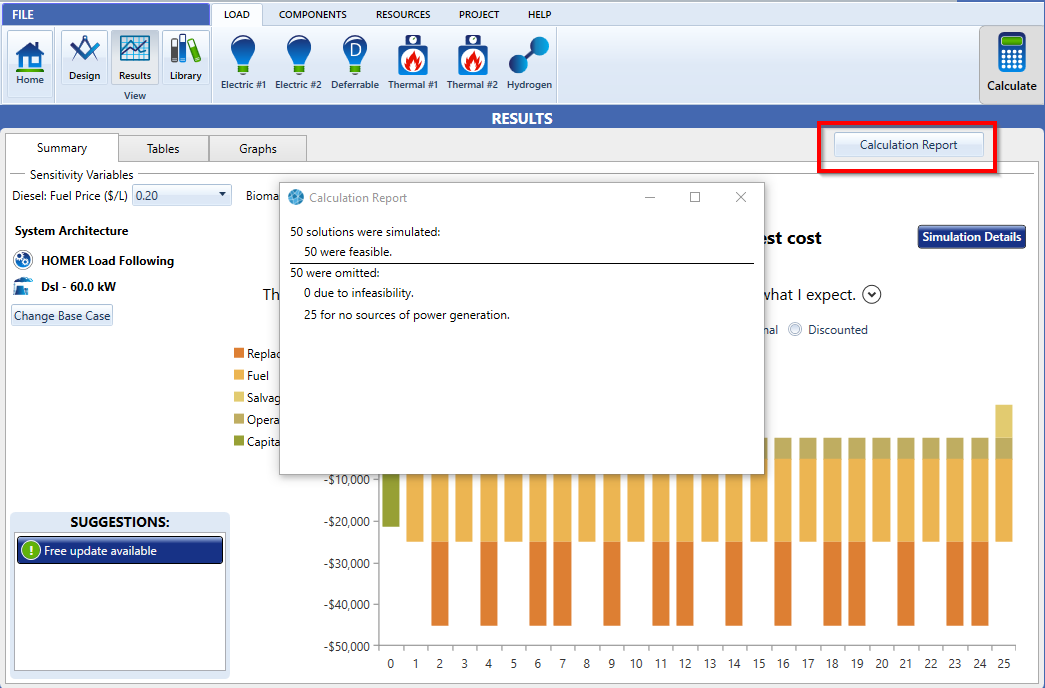
2.Get details from Calculation report. You may access this by clicking the Calculation Report button as shown below. The calculation report will give you insight into what simulations were tested but found infeasible, if any. Based on information from the calculation report, you may want to adjust the inputs to your model.
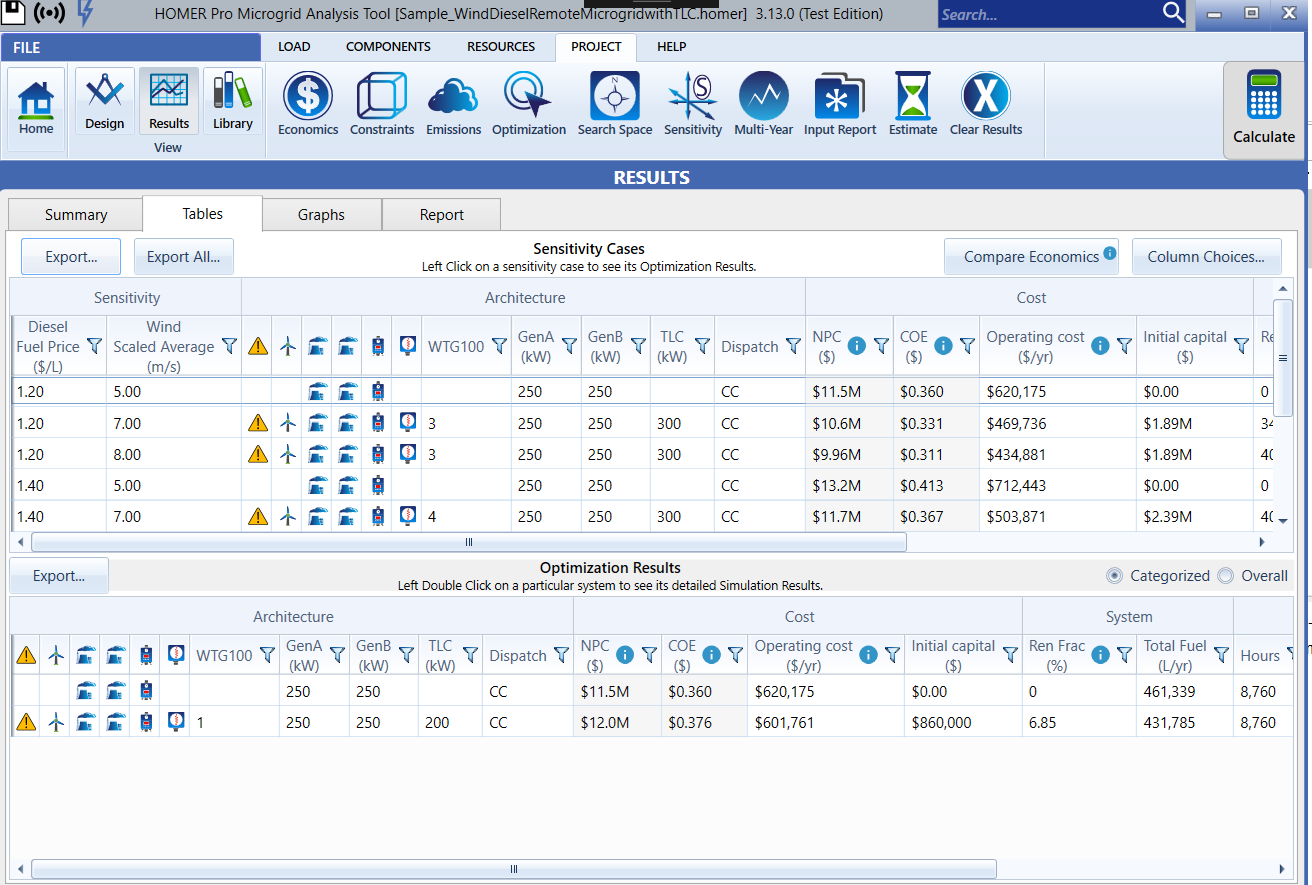
3.If NPC isn’t the metric that you are interested in, you may access other system configurations in the Tables tab as shown below. In the Tables tab, you may see the whole range of simulations which were calculated by clicking the Overall view instead of the Categorized view. You may choose, for example, which simulation has the lowest annual utility bill or which system has the highest renewable fraction. These other metrics may be more important than the lowest NPC system.
This result is what I expect
If you expected the utility only system to win or the base case to win, you may then
1.Access the simulation results to get the cash flow, Time Series, etc.
2.Access other system configurations in the Tables tab.
