HOMER Pro 3.16

![]()
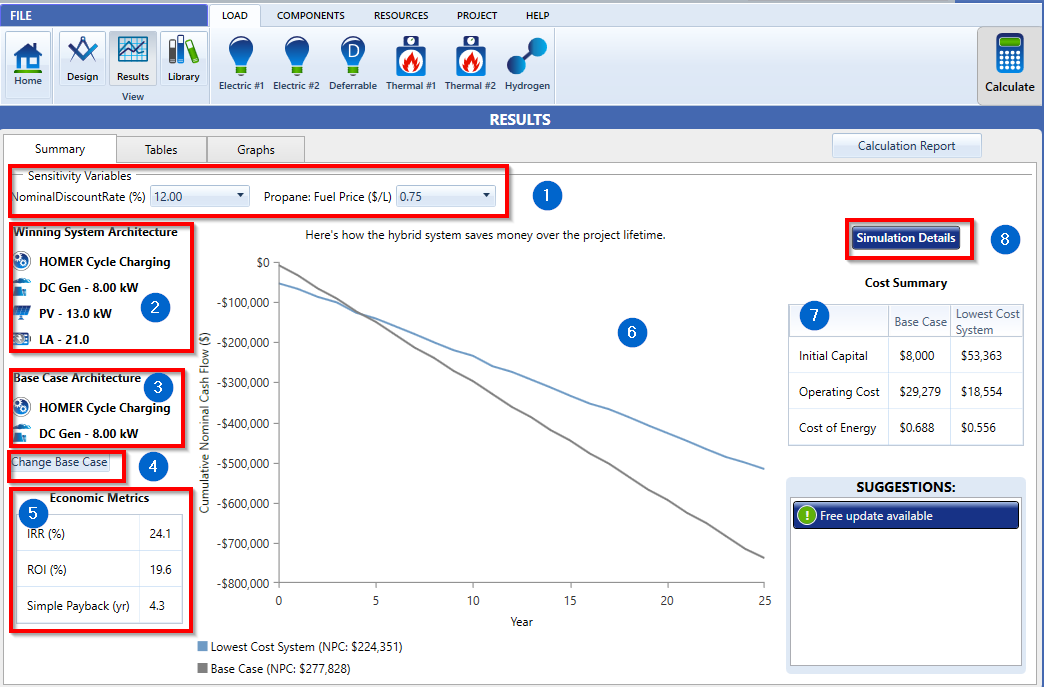
The image provided below is an example of how the summary tab looks with a base case and winning case. The sections numbered in the image are described in the table below.

Section |
Variable |
Description |
1 |
Sensitivity Variables |
This section lists the sensitivities in the HOMER model. If you have no sensitivities, then this section is blank. The winning system and the base case are for the sensitivity currently selected. |
2 |
Winning System Architecture |
This section shows the architecture of the winning system along with the system sizes. |
3 |
Base Case Architecture |
This section shows the architecture of the base case system along with the system sizes of components if any. |
4 |
Change Base Case |
This button allows you to change the base case by clicking on the “Change Base Case” button. |
5 |
Economic Metrics |
This section compares the economics of the winning system with the base case system and lists the Internal Rate of Return (IRR), Return on Investment (ROI) and Simple Payback. |
6 |
Plot of Cash flow over Project Lifetime |
This section is a plot displaying how the hybrid system saves money over the project lifetime: the cumulative nominal cash-flow over the project lifetime. The blue line is the winning system and the gray line is the base case system. The simple payback in years occurs when the two lines cross each other and is highlighted by the black line in the plot. |
7 |
Cost Summary |
This sections gives a comparison between the costs (initial, operating and cost of energy) of both the base case and lowest cost/winning system. |
8 |
Simulation Details |
This button gives you access to the simulation details of the winning system – cash-flow, Time Series, etc. This is a short-cut to the simulation results for the lowest NPC system, which you can also access from the ‘Tables’ tab. |
