
HOMER Pro 3.16

![]()
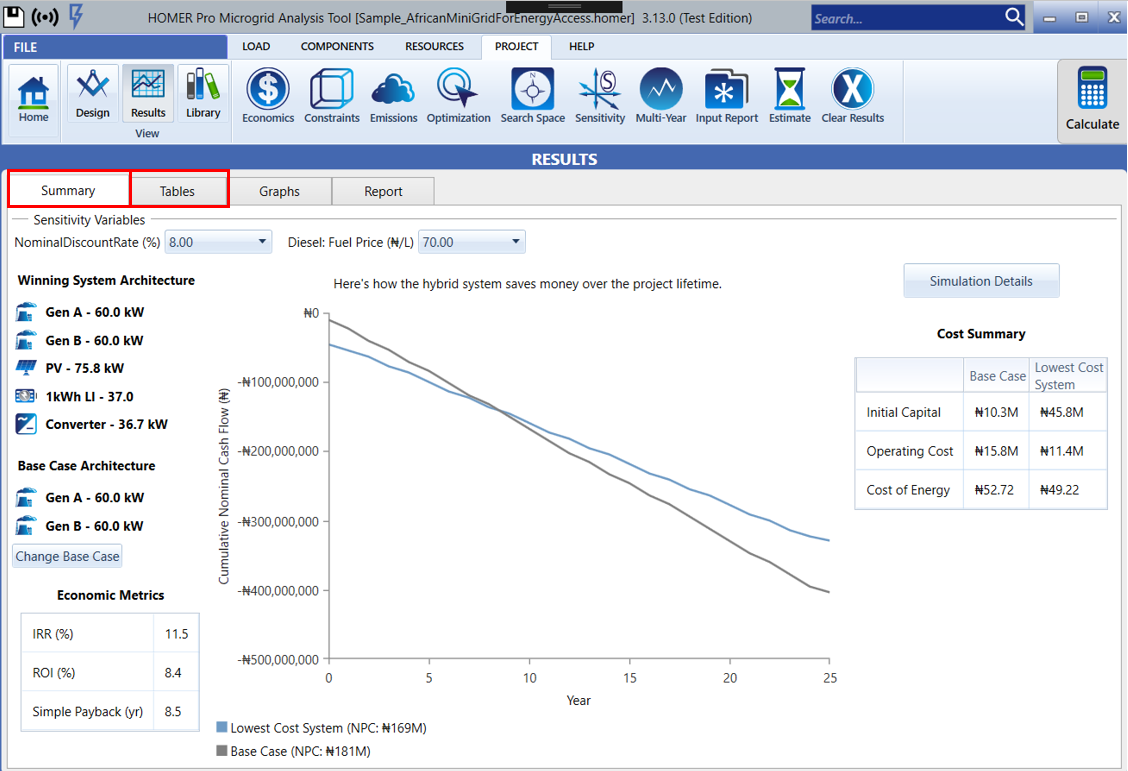
The Summary page provides an overview of the winning system - system with the lowest Net Present Cost in comparison to the base system - the system with the lowest capital cost. If you would like to see the results in tabular format, click on the Tables tab next to the Summary Tab shown below.
Note: the Summary Tab will appear different if the base case is the winning system or if there are no feasible solutions. Visit Summary Types for more details.
Summary Variables
Winning System Architecture
The winning system is the system with lowest Net Present Cost. You may select a different winning system on the summary tab by changing the sensitivity variables from the drop-down menu. If there are no sensitivity variables, this section will appear blank. To view details for other system configurations, select the Tables tab.
Base Case Architecture
The base case system is the system with the lowest initial capital cost. There could be scenarios where the base case system is also the winning system. You may change the base case system in the summary tab if you select the Change Base Case button.
Economic Metrics
The Economic Metrics table shows economic measures representing the value of the difference between the two systems.
•Internal rate of return (IRR) is the discount rate at which the base case and current system have the same net present cost. HOMER calculates the IRR by determining the discount rate that makes the present value of the difference of the two cash flow sequences equal to zero.
•The Return on Investment (ROI) is the yearly cost savings relative to the initial investment. The ROI is the average yearly difference in nominal cash flows over the project lifetime divided by the difference in capital cost.
•Simple payback is the number of years at which the cumulative cash flow of the difference between the current system and base case system switches from negative to positive. The payback is an indication of how long it would take to recover the difference in investment costs between the current system and the base case system.
Plot of Cash flow over Project Lifetime
The plot in the center of the Summary Tab displays how the hybrid system saves money over the project lifetime- the cumulative nominal cash-flow over the project lifetime. The blue line represents the winning system and the gray line represents the base case system. The simple payback in years occurs when the two lines cross each other and is highlighted by the black line in the plot.
Cost Summary
The cost summary shows a cost comparison between the Base Case and the lowest cost system/winning system.
•The Initial Capital is the total installed cost of the system at the beginning of the project.
•The Operating Cost is the annualized value of all costs and revenues other than initial capital costs.
•The Cost of Energy (COE) is defined in HOMER as the average cost per kWh of useful electrical energy produced by the system.
See Also
