
HOMER Grid 1.10


Click the PV Production button under the Resources tab. The PV Production Resource page appears.
You can import a time series data file or view your imported HelioScope or PVsyst data here. If you enter a scaled average different from the average of the baseline data, HOMER offsets the data to correspond to the average value that you enter.
The "Plot" button allows you to view the scaled data in several graphical formats.
Choose a Data Source
The baseline data is a time series representing the average daily production for each time step of the year. HOMER displays the monthly averages in the Monthly Average PV Production Data table and graph.
You can import your PV Production Data in one of four ways
•Import time series data file from the "Import..." or "Import and Edit..." button
•Import time series data from a .csv file using the PV Production Import tab
•Import data from your HelioScope account
•Import a PVsyst design file
Monthly Averages
You can view your imported Daily Production (kWh/kWpeak/day) in the Monthly Average PV Production Data table.
Import PV Production Data
You can prepare your own text file containing the PV Production Data in each time step for a year.
Tip: You can import data with time steps of many sizes between 60 minutes and one minute. HOMER detects the time step when you import the data file. For example, if the data file contains 8760 lines, HOMER assumes it contains hourly data. If the data file contains 52,560 lines, HOMER assumes it contains 10-minute data.
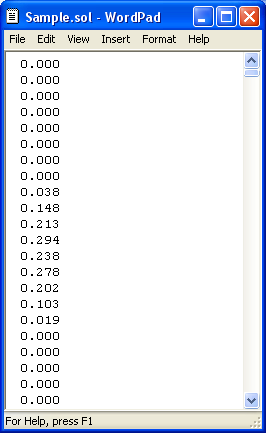
The data file must contain a single value on each line, corresponding to one time step. Each value in the file represents the PV production (kW) for that time step. The first time step starts at midnight on January 1st. The following is a sample input file.
Click the Import button to open the text file. You can import a text file with any extension.
When you import data from a text file, HOMER makes a copy of the data set and integrates it with the HOMER (.homer) file. After the data is part of the HOMER file, HOMER no longer refers to the original text file. If you modify data in the original file, you must import the modified file in order for the modification to be included in the HOMER file. After you import a data file, HOMER calculates monthly average values and displays them in the table and graph. HOMER also displays the name of the imported data file in the title of the graph.
Scaled Data for Simulation
HOMER uses scaled data for calculations. To create scaled data, HOMER multiplies each of the values in the baseline data by a common factor that results in an annual average value equal to the value that you specify in the Scaled Annual Average box.

To determine the value of this factor, HOMER divides the Scaled Annual Average by the baseline annual average. The scaled data retains the shape and statistical characteristics of the baseline data, but may differ in magnitude. The default value for the Scaled Annual Average is the baseline annual average. When the two values are equal, the scaled data and baseline are identical.
Two reasons to use a different Scaled Annual Average than the baseline annual average are for unit conversion and sensitivity analysis.
See also
