
HOMER Pro 3.16

![]()
Click the Wind button under the Resources tab in the toolbar at the top of the page. The Wind Resource page appears.
You can use the Wind Resource page to describe the available wind resource. HOMER uses this data to calculate the output of a wind turbine in each time step. This page provides access to the following tabs:
•Parameters: Variables related to altitude
•Variation with Height: Parameters describing wind shear and the wind velocity's vertical profile
•Advanced Parameters: Parameters controlling variation of the wind over time
You can download monthly average wind resource data from the HOMER Software or click on the Windnavigotor link for improved wind modeling. You can also visit the Finding data to run HOMER section of the help for additional resources.
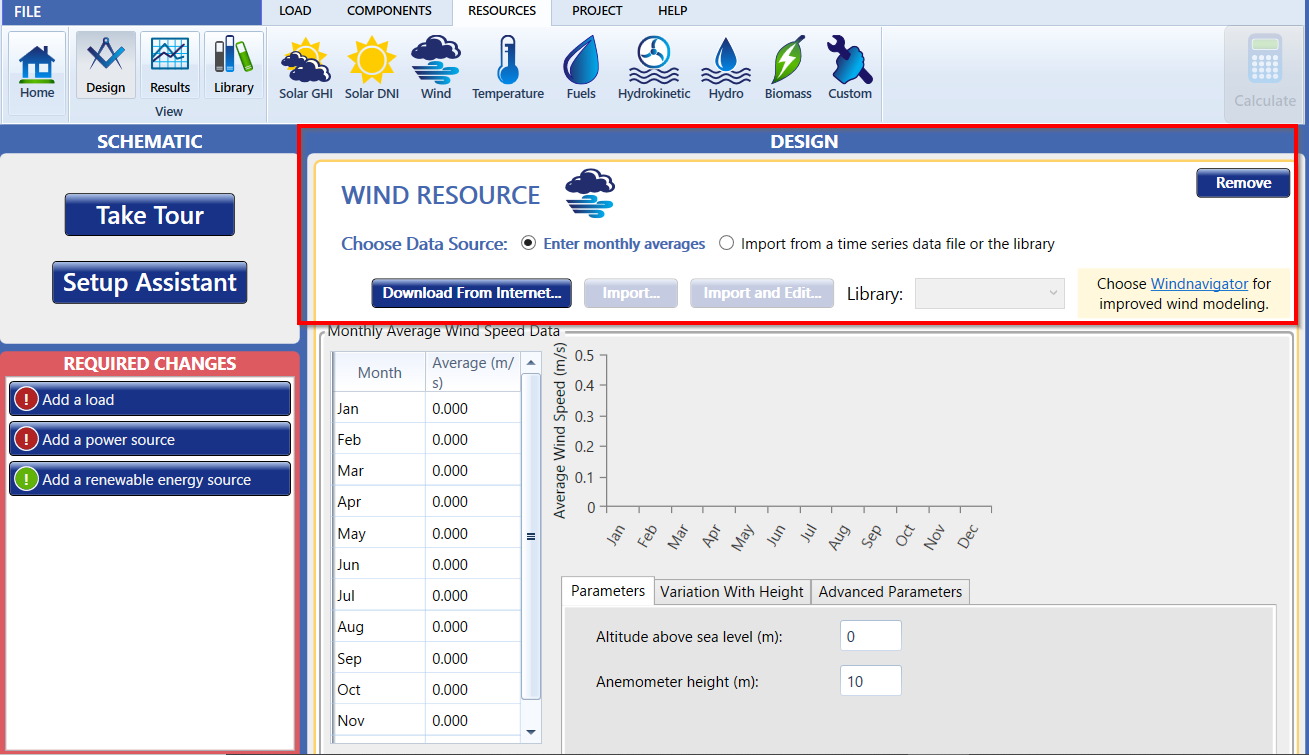
Choose a Data Source
The baseline data is a one-year time series representing the average wind speed, expressed in meters per second, for each time step of the year. HOMER displays the monthly averages calculated from the baseline data in the wind resource table and graph.
You can create baseline data by downloading data from the HOMER Software, entering monthly average manually and using HOMER to synthesize time series data, or by importing time series data from a file.
Click either the Enter monthly averages radio button or the Import from a time series data file or the library radio button.
Enter Monthly Averages
If you selected Enter monthly averages, you can enter resource data in the Monthly Average Wind Speed Data table either manually or by downloading it from the HOMER website.
To synthesize data, you must enter or download twelve average wind speed values: one for each month of the year. To download the monthly averages for synthesized wind data, be sure to first select your location on the Home Page. Then click the Download from Internet button to download the averages from the HOMER website. Wind resource data comes with the anemometer height at which the wind speed was measured. Downloading a wind resource automatically sets this input to the correct value. The wind resource data available for some regions includes values for the four advanced parameters. For these regions, the four parameters are set when you download the wind resource. You can also edit the four advanced parameters manually.
To input data manually, enter each month's average wind speed (m/s) in the table. As you enter values in the table, HOMER synthesizes time series data with the statistical characteristics you have specified. For more information, see the synthetic wind data section of the help.
Import Wind Speed Data
To import a file, you must prepare a text file that contains the wind speed in each time step for a complete year.
Tip: You can import data with any time step down to one minute. HOMER detects the time step when you import the data file. For example, if the data file contains 8760 lines, HOMER assumes it contains hourly data. If the data file contains 52,560 lines, HOMER assumes it contains 10-minute data.
The data file must contain a single value on each line, corresponding to one time step. Each value in the file represents the average wind speed (in m/s) for that time step. The first time step starts at midnight on January 1st. The following is a sample input file.
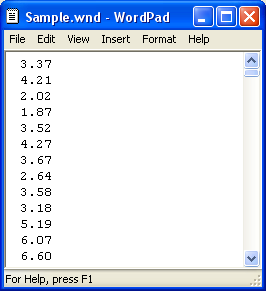
Click the Import button or the Import and Edit button to open the text file. You can import a text file with any extension.
When you import data from a text file, HOMER makes a copy of the data set and integrates it with the HOMER (.homer) file. After the data is part of the HOMER file, HOMER no longer refers to the original text file. If you modify data in the original file, you must import the modified file in order for the modification to be included in the HOMER file. After you import a data file, HOMER calculates twelve monthly average wind speed values and displays them in the table and graph. HOMER also displays the name of the imported data file in the title of the graph. HOMER calculates the four advanced parameters from the imported data and displays them (read-only) in the text boxes.
If you click the Enter monthly averages radio button after importing data from a file, HOMER discards the data from the imported file and synthesizes new data based on the twelve monthly average wind speed values and four advanced parameters it calculated from the imported data. You can edit synthesized data by changing values in the monthly wind speed table. To edit values from an imported file, you must edit the file directly and then import the modified file, as described above.
Scaled Data for Simulation
HOMER uses scaled data for calculations. To create scaled data, HOMER multiplies each of the baseline data values by a common factor that results in an annual average value equal to the value that you specify in the Scaled Annual Average box.
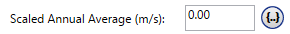
To determine the value of this factor, HOMER divides the Scaled Annual Average by the baseline annual average. The scaled data retains the shape and statistical characteristics of the baseline data, but may differ in magnitude. The default value for the Scaled Annual Average is the baseline annual average. When the two values are equal, the scaled data and baseline are identical. HOMER interprets a Scaled Annual Average of zero to mean that there is no wind resource.
Two reasons to use a different Scaled Annual Average than the baseline annual average are for unit conversion and sensitivity analysis.
An example of using the Scaled Annual Average for unit conversion is to convert data from an imported file that contains wind speed expressed in kilometers per hour. If the baseline annual average is 20 km/hr, if you enter 5.56 in Scaled Annual Average, the scaled data is equivalent to the baseline data, but expressed in m/s rather than km/hr: 1 m/s = 3.6 km/hr; 5.56 m/s = 20 km/hr.
Note: To the right of the Scaled Annual Averages input is a sensitivity button ( ) that allows you to do a sensitivity analysis on that variable. For more information, see Why Would I Do a Sensitivity Analysis?
See also
How HOMER Calculates Wind Turbine Power Output
Generating Synthetic Wind Data
