
HOMER Pro 3.16

You can create time-series wind speed data using HOMER's synthetic wind speed data-synthesis algorithm if you do not have measured wind speed data. This algorithm requires you to enter a few parameters, from which it generates artificial but statistically reasonable time-series data. The algorithm produces data that mimic the characteristics of real wind speed data, including strong and sustained gusts, long lulls between windy periods, and seasonal and diurnal patterns.
Tip: When you import measured wind speed data, it can have any time step down to one minute. Similarly, when you generate synthetic wind data, it can have any time step down to one minute.
Parameters
To generate synthetic wind speed data, go to the Wind Resources page and click the Enter monthly averages radio button. You can enter twelve monthly average wind speeds, or select the project location on the Home page and click the "Download From Internet..." button on the Wind Resource page. HOMER uses the monthly average wind speeds, plus the four parameters in the following table, to synthesize wind data for simulation.
Parameter |
Description |
Default |
Reflects the breadth of the distribution of wind speeds over the year |
2.0 |
|
Reflects how strongly the wind speed in one time step tends to depend on the wind speed in the previous time step |
0.85 |
|
Reflects how strongly the wind speed depends on the time of day |
0.25 |
|
The hour of day that tends to be windiest on average |
15 |
The HOMER resource database has data for some regions that include specific values for these four parameters for each location. If you download a resource that includes values for these inputs, the resource values are filled automatically. If the wind resource does not change these values from their defaults, you can estimate the value of each of these parameters without detailed knowledge of the wind data in a particular location, as described in the help sections for each of the parameters. The Wind Data Histograms section of the help also describes typical values and the distributions of these parameters.
Algorithm
HOMER follows a five-step process to synthesize one year of time series wind speed data.
Step 1
In the first step of the algorithm, HOMER generates a sequence of autocorrelated numbers, one for each time step of the year, using the first-order, autoregressive model:
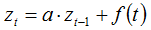
where: |
|
|
|
zt |
= the value in time step i |
|
zt-1 |
= the value in time step i-1 |
|
a |
= the autoregressive parameter |
f(t) |
= a "white noise" function that returns a random number drawn from a normal distribution with a mean of zero and a standard deviation of 1 |
HOMER sets the autoregressive parameter equal to the one-time-step autocorrelation coefficient:

On the Wind Resource page, enter the one-hour autocorrelation coefficient, which is different from the one-time-step autocorrelation coefficient if the time step is not 60 minutes.
To calculate the one-time-step autocorrelation coefficient from the one-hour autocorrelation factor, HOMER assumes logarithmic decay in the autocorrelation function, in which case the following equation gives the autocorrelation parameter for a lag of k time steps:

Solving that for r1 gives:
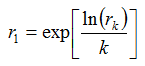
The one-hour autocorrelation factor is rk where k is the number of time steps that fit in one hour, meaning:

Where t is the time step in minutes.
This first step of the algorithm produces a series of numbers that conform to a normal distribution with a mean of zero and a standard deviation of 1.
Step 2
In the second step of the algorithm, HOMER creates a full year of data by piecing together the desired average diurnal wind speed profile, repeated every day. Because the average wind speed varies by month, the average diurnal wind speed profile scales to a different value each month, but within each month the diurnal pattern simply repeats over and over.
Step 3
In the third step, HOMER performs a probability transformation on the sequence of numbers generated in Step 2 so that it conforms to the same normal distribution as the sequence generated in Step 1.
Step 4
In the fourth step, HOMER adds the sequence generated in Step 3 to the sequence generated in Step 1. The resulting sequence conforms to a normal distribution, but exhibits the desired degree of autocorrelation.
Step 5
In the fifth and final step, HOMER performs a probability transformation on the sequence generated in Step 4 to make it conform to the desired Weibull distribution.
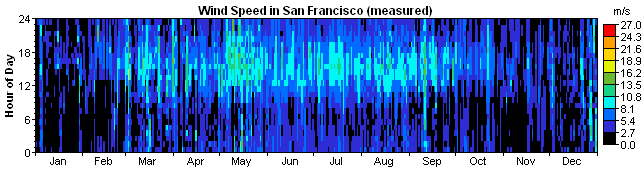
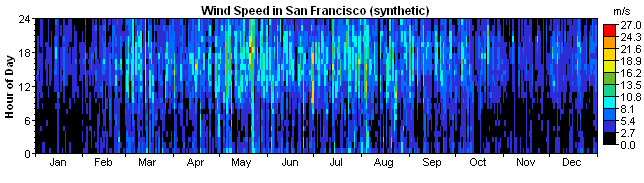
The two DMaps below demonstrate the results of the synthetic wind data generation algorithm. The first shows the measured wind speed data for San Francisco, California from the TMY2 data set. The second shows the synthetic wind speed data that HOMER generated from the monthly average wind speeds and the four wind data parameters measured from the real data.
For assistance in finding wind data, see Finding data to run HOMER.
See also
