
HOMER Pro 3.16

Type: |
Input Variable |
Units: |
none |
Symbol: |
r1 |
Typical Range: |
0.80 - 0.95 |
The autocorrelation factor reflects how strongly the wind speed in one time step depends on the wind speeds in previous time steps. A high autocorrelation factor indicates that the wind speed tends to depend strongly on the wind speed in the previous time step. Lower values indicate that the wind speed tends to fluctuate in a more random fashion from one time step to the next. Among other factors, local topography can influence this parameter. Autocorrelation factors tend to be lower (0.70 - 0.80) in areas of complex topography and higher (0.90 - 0.97) in areas of more uniform topography.
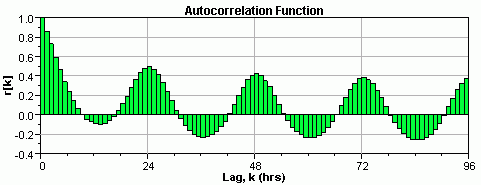
The autocorrelation factor involves the typical autocorrelation characteristics of measured wind speed data. As described in the autocorrelation section of the help, the daily patterns in the wind data tend to complicate its autocorrelation function. The graph below shows the autocorrelation function for the hourly wind speed data measured at San Diego, California.
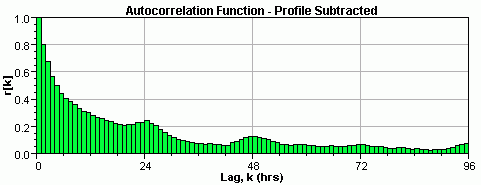
To simplify the autocorrelation characteristics of wind data, HOMER factors out the diurnal pattern. HOMER does this by calculating the average diurnal profile, and then subtracting that profile from the wind speed data. For example, if the diurnal profile showed an average wind speed of 3.2 m/s at 1:00 a.m., then HOMER subtracts 3.2 m/s from all 365 values of wind speed at 1:00 a.m. It does the same for all 24 hours of the day, resulting in a time series that has an average of 0 m/s and no daily pattern. The autocorrelation function of this new time series typically displays almost no oscillation. The graph below shows the autocorrelation function for the San Diego data after subtracting out the diurnal profile:
The autocorrelation function shown above dies down in a way similar to damped exponential, so a good approximation is:

Therefore, the degree of correlation is a single parameter. In HOMER, this is called the one-hour autocorrelation factor, which is rk an k is the number of time steps in one hour. If the time step is 60 minutes, the one-hour autocorrelation factor is r1. If the time step is 20 minutes, the one-hour autocorrelation factor is r3. If the time step is 10 minutes, the one-hour autocorrelation factor is r6.
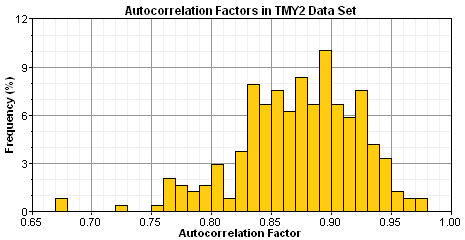
To help HOMER users estimate the one-hour autocorrelation factor in the absence of measured data, we calculated the autocorrelation factor for each of the 239 weather stations in the TMY2 data set. The histogram below shows the resulting distribution. You can see the measured values themselves in the TMY2 wind parameters table.
The complexity of local topography has a significant effect on the autocorrelation factor. Areas surrounded by a variety of different types of topography tend to have low (0.70 - 0.80) autocorrelation factors. For example, the stations with the lowest autocorrelation factors in the table of measured wind parameters are Los Angeles, CA; Denver, CO; Phoenix, AZ; Lander, WY; Seattle, WA; and Salt Lake City, UT. Each of these cities is surrounded by complex topography: mountains or hills on one side, and plains or open water on another. In such surroundings, shifts in wind direction can result in the wind having a very different character. So there is less persistence of wind speeds and, therefore, lower autocorrelation (Brett and Tuller, 1991).
Areas surrounded by more uniform topography tend to have high (0.90 - 0.97) autocorrelation factors. The stations with the highest autocorrelation factors in the table of measured wind parameters include Cut Bank, MT; St. Paul Island, AK; and the island of Guam. Each of these sites is surrounded by relatively featureless topography, either plains or open water.
Note: the autocorrelation factor is independent of the Weibull k value. Whereas the Weibull k value reflects the breadth of the annual distribution of wind speeds, the autocorrelation factor reflects how randomly the wind speeds vary from hour to hour. The data contained in the table of measured wind parameters shows no correlation between these two parameters.
See also
