
HOMER Pro 3.16

A probability transformation is a statistical procedure used to modify a set of numbers to conform to a desired probability distribution function.
To perform a probability transformation, HOMER first calculates the cumulative distribution function of the original set of data, or the original CDF. Then, for each original data point, HOMER performs the following steps:
1.HOMER uses the original CDF to calculate the percentile value corresponding to that original data point.
2.HOMER uses the desired CDF to calculate the transformed value corresponding to that same percentile value.
For example, when synthesizing wind speed data, HOMER transforms a set of data that conforms to a normal distribution to one that conforms to a Weibull distribution, as described below.
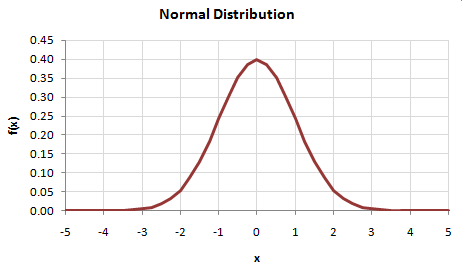
If the normally-distributed data has a mean of zero and a standard deviation of 1, its probability distribution function appears as shown below.
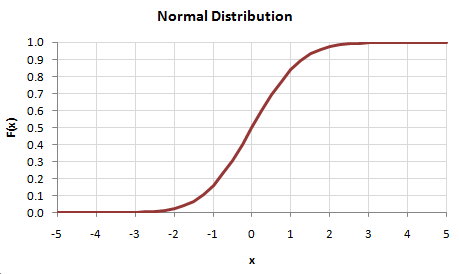
Its cumulative distribution function, the original CDF, appears as shown below.
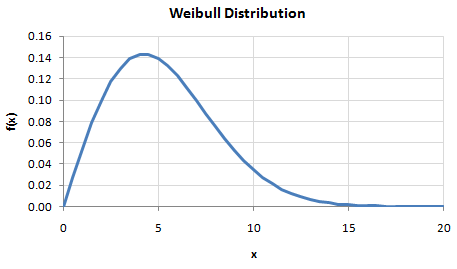
When the data is transformed to fit a Weibull distribution with a mean value of 6 and a Weibull k value of 2, the desired probability distribution function appears as shown below.
The desired cumulative distribution function, or desired CDF, appears as shown below.
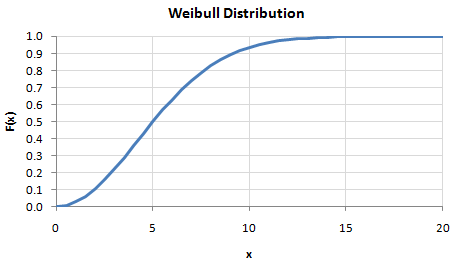
To transform each value in the original data set, HOMER uses the original CDF to find its corresponding y-value, then uses that y-value for the desired CDF and find its corresponding x-value.
An original value of zero, for example, corresponds to a CDF value of 0.5 on the original CDF. For the desired CDF, the value corresponding to a CDF value of 0.5 is approximately 5. So any zero value in the original data set is transformed into a value of 5 in the transformed data set. Similarly, an original value of -1 is transformed to a value of approximately 2.5, and an original value of 1.5 is transformed to a value of approximately 10.
This example transforms data from a normal distribution to a Weibull distribution, but with this same probability transformation approach, we can transform data from any distribution to any other distribution.
