| Reconstruction Uncertainty Test Window |  |
This window lets you perform a cross-validation test to determine the uncertainty with which Windographer can reconstruct your data. You can test both the process of reconstruction across datasets and the process of reconstruction within a dataset.
Windographer's reconstruction uncertainty test uses a cross validation approach called k-fold cross validation, in which a dataset is partitioned randomly into k mutually exclusive subsets of equal size, called folds. Then k tests are performed, in the first of which the first fold is held out as a test dataset, while the remaining folds are used as a training dataset. In the second test, the second fold is held out as a test dataset, while the remaining folds are used as a training dataset, and so on, so that in the course of the k tests every data point is left out and used for testing once. For each test dataset, some model is applied to the training dataset and then evaluated on the test dataset to determine the error of the model. The distribution of errors across the k tests indicates the uncertainty of the model.
In the reconstruction uncertainty test the k-fold cross validation process works as follows. We begin with a data column of wind speed, direction, or some other data type. For an example we'll use this 15-month temperature time series:

And for clarity we'll zoom into a two-month section of that time series:

If we randomly partition that time series into five (k = 5) mutually exclusive folds and give each fold a distinct color we might produce something like this:

As the above graph demonstrates, Windographer partitions a time series by taking a short segment of random length and assigning it to a randomly-selected fold, then taking the next segment of random length and assigning it to another randomly-selected fold, and so on until it reaches the end of the time series. The resulting folds do not overlap with each other, they add up to the original time series, and they each have roughly equal seasonal and diurnal coverage.
Having generated these five folds, we can prepare five cross validation tests. For the first test, we take the first fold as the 'test dataset':

The remaining data serves as the 'training dataset':

We run the reconstruction process on the training dataset, and then compare the reconstructed data to the test data that we held back from the reconstruction process:

Subtracting the true values from the predicted values yields an error time series:

The mean of that error time series is MBETS, the time series mean bias error, which appears in the results table as highlighted by the yellow arrow in the screenshot below. The root mean square of that error time series is RMSETS, the time series RMS error, which also appears in the results table as highlighted by the blue arrow in the screenshot below.

The test then proceeds to the second fold and repeats this process, this time removing the second fold for the test dataset, and using the other four folds as the training dataset. Again we reconstruct the training dataset, compare the reconstructed data against the test dataset, and calculate the resulting error metrics. Onward to the third, fourth, and fifth tests, each of which extracts a different fold for validation:


This entire process represents one 'iteration' of the k-fold cross validation procedure. For a more robust test, one can perform multiple iterations, in each iteration performing a different random subdivision of each dataset into k mutually exclusive folds.
Having generated N * k values (where N is the number of iterations) of MBETS, we can calculate their mean, which is a measure of the bias of the reconstruction process, and their standard deviation, which is a measure of its uncertainty. These bias and uncertainty values appear in the results table, as highlighted in the screenshot below by the yellow arrow and blue arrows, respectively:

These bias and uncertainty values measure the accuracy with which Windographer was able to reconstruct this particular data column, with the settings you specified. But the test process makes similar measurements for every reconstructed data column, and summarizes the results (by data column type) across each dataset and across all datasets combined.
In this description we have looked at the overall error values for all reconstruction mechanisms combined, but Windographer also breaks down these numbers by reconstruction mechanism, so that you can see separately the uncertainty of the MCP-based mechanism, the pattern-based mechanism, and the Markov-based mechanism.
The 'similarity assumption' is the assumption that the unknown data behaves the same as the known data. The similarity assumption can be seen as reconstruction's competitor, since the alternative to reconstructing the gaps in a dataset is to leave the gaps in the dataset, and to assume implicitly that the dataset accurately represents reality despite the gaps.
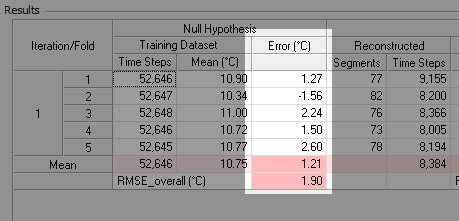
The cross-validation process provides a convenient means of testing the similarity assumption in a manner consistent with the test of the reconstruction process. For each pair of training and testing datasets, we compare the simple mean of the training dataset with the simple mean of the testing dataset. The difference between those two means is the bias error of the similarity assumption:

Those bias errors appear as a column in the detailed results table, as the screenshot below shows. Their mean represents the mean bias error of the similarity assumption, which should quickly approach zero as the number of iterations increases. Their standard deviation represents the uncertainty of the similarity assumption.

See also
MCP-based reconstruction mechanism
Pattern-based reconstruction mechanism
Markov-based reconstruction mechanism
Process of reconstruction across datasets
Process of reconstruction within a dataset