| Test MCP Uncertainty Window |  |
This window tab uses a bootstrapping approach to test the uncertainty of the MCP process. To acces this window, click Test Uncertainty on the Synthesize Data tab of the Long Term Adjustments window.
In this test procedure, Windographer performs many iterations of the MCP process, each time using the algorithms and settings you have specified in the Correlate Speed, Correlate Direction, and Correlate Temperature tabs, but each time drawing a different random sample of the available concurrent data, training the speed, direction, and temperature algorithms on that data, creating the extended dataset with those algorithms, and then recording the following summary statistics of that extended dataset:
You can specify how many iterations to perform, and whether you would like Windographer to export the detailed intermediate results to the folder of your choice.
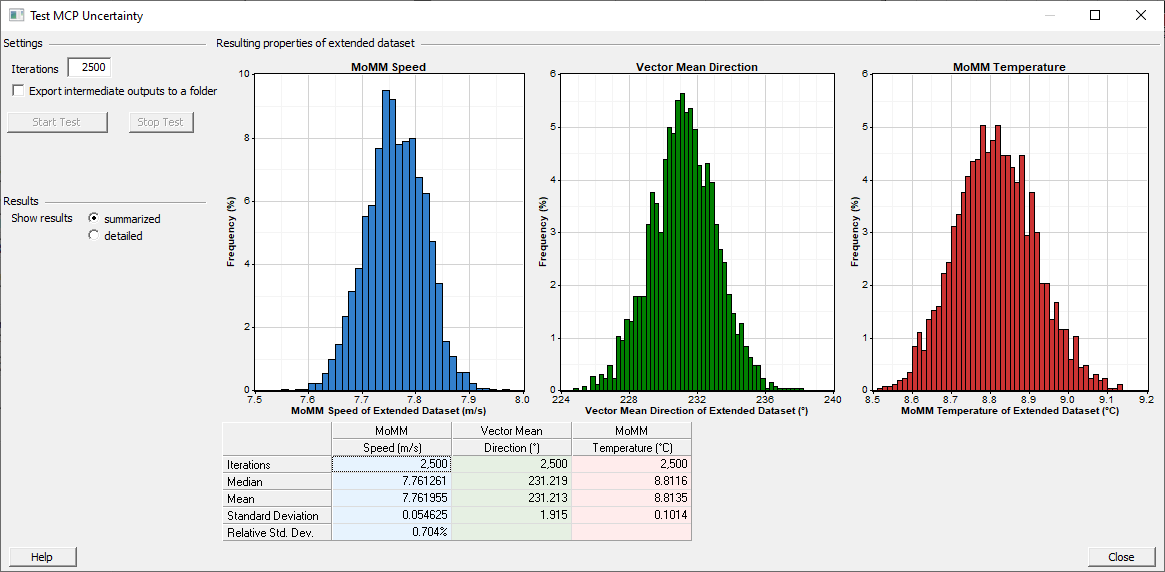
The detailed results table reports the three summary statistics for every bootstrap dataset modeled, and the summary results table reports the mean, median, and standard deviation of each. The screenshot below shows an example in which the analyst ran 2500 iterations of the bootstrap process. Each iteration produced a predicted value of the MoMM wind speed, and the summary table shows that those 2500 values of MoMM wind speed had a mean value of 7.762 m/s and a standard deviation of 0.0546 m/s. The summary table similarly reports the mean and standard deviation of the 2500 values of vector mean direction and MoMM temperature.

The histogram graphs above show that the distributions of mean speed, direction, and temperature values conform nicely to normal distributions. With fewer iterations the distributions will diverge more from the normal distribution, but you do not need to achieve a perfect normal distribution. As long as the standard deviation values have converged you have performed sufficient iterations. Convergence usually occurs within a few hundred iterations.
See also