
| Pearson Correlation Coefficient | |
The Pearson correlation coefficient is a measure of the linear dependence between two variables. If one variable were plotted versus the other on a cartesian graph and a straight line could be drawn through all of the data points with most of the points resting very close to the line, the correlation between the variables is high. Conversely, if no straight line could be drawn such that most points are close to the line, the correlation is low. The correlation coefficient, r, has a value of 1 if the variables are perfectly positively correlated (they increase and decrease together), -1 if the variables are perfectly negatively correlated (one increases as the other decreases and vice-versa), and 0 if there is no correlation. Windographer tends to report the value of r², which varies from 0 to 1 and indicates the strength of the correlation but not its direction.
Windographer calculates the Pearson correlation coefficient using the following equation:
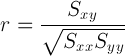
and: | ||
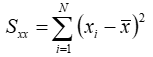
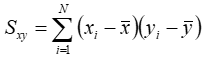
| xi | is the ith value of the first variable | |
| x | is the mean value of the first variable | |
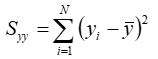
| yi | is the ith value of the second variable | |
| y | is the mean value of the second variable |
In the special case where one of the variables is obtained by performing a linear least squares regression on the other variable and taking the y-values from the corresponding fitted curve, r² is equivalent to the R², the coefficient of determination.
Windographer reports r², the square of the Pearson correlation coefficient, in several places including the Scatter Plot and Long Term Adjustements windows.
See also