| Autocorrelation Coefficient |  |
Meteorological variables like wind speed, temperature, and relative humidity tend to display autocorrelation, meaning a tendency of the current value to depend on values observed in the recent past. If it is windy now, for example, it is likely to be windy an hour from now.
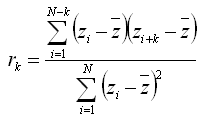
The autocorrelation coefficient can be defined as the degree of autocorrelation. For a time series z1, z2, z3, ..., zN, we can define an autocorrelation coefficient rk as follows:

where: | ||
| rk | is the autocorrelation factor for a time lag of k time steps | |
| N | is the number of time steps | |
| zi | is the value in time step i | |
| z | is the average value over the N time steps |
The autocorrelation coefficient rk represents the degree to which the value in one time step tends to depend on the value k time steps in the past. For example, if r3 were equal to 0.8, that would indicate that on average, the value in one time step is 80% determined by the value three time steps in the past, and 20% determined by randomness and other factors. By definition, r0 = 1.
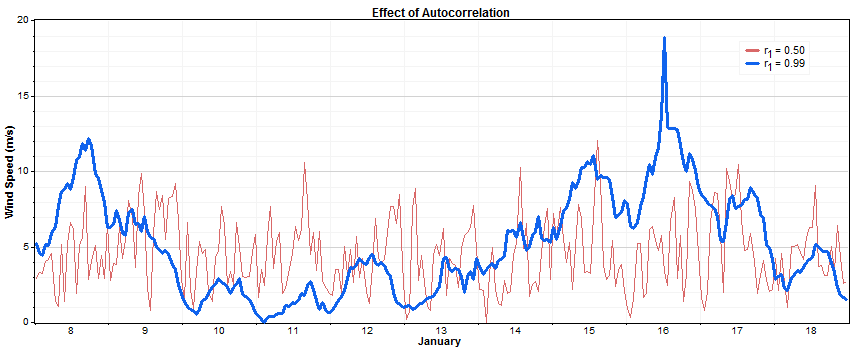
The graph below illustrates the effect of autocorrelation. It shows two time series of hourly wind speed, both synthesized using the Synthesize Wind Speed Data Tool window using the same diurnal pattern and the same Weibull distribution. They differ only in the degree of autocorrelation: the one-time-step autocorrelation coefficient is 0.50 for the one plotted in red, and 0.99 for the one plotted in blue. Periods of high and low winds tend to persist much longer in the strongly autocorrelated sequence.

Real measured wind speed data typically exhibit one-hour autocorrelation coefficients between 0.65 and 0.98, so the red and blue time series in the graph above exhibit extremely low and extremely high autocorrelation, respectively.
See also
One-hour autocorrelation coefficient
Synthesize Wind Speed Data tool