
HOMER Grid 1.10


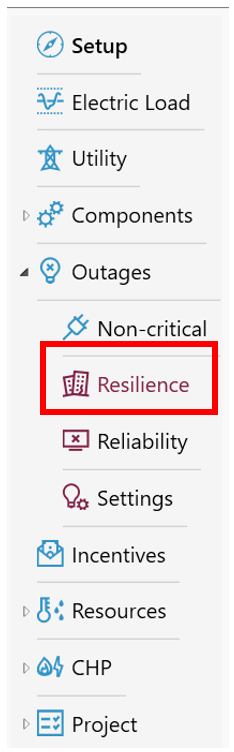
HOMER Grid can model stand-alone systems for resiliency applications. Resilience is defined as the ability for a system to respond to an extended, multi-day utility outage like a natural disaster such as hurricanes, wild fires. During a resilience event, only the critical electrical load and the thermal load, if applicable, are served. Non-critical loads can be entered in the Non-critical Load menu. You can find Resilience listed under the Outage section as shown below.
The purpose of modeling resilience as a value stream is to account for the costs and the ability to operate off-line in an emergency. There are costs associated with running the back-up equipment necessary to serve the critical load.
Resilience Inputs
The input variables are as follows
Variable |
Description |
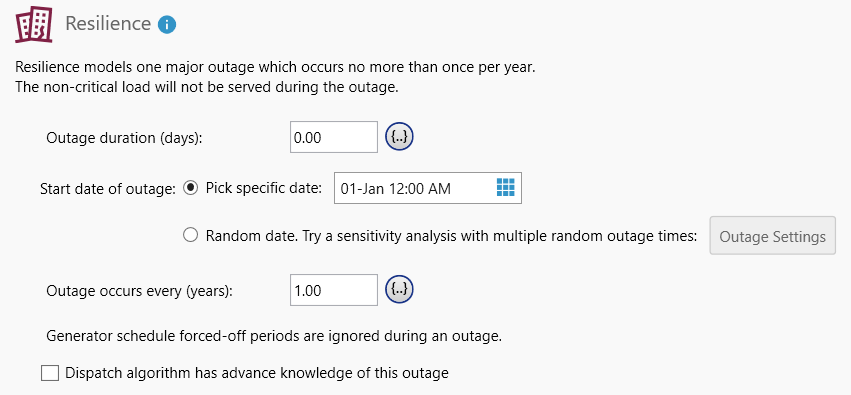
Outage Duration (days)
|
The number of days that the grid will not provide electricity. |
Start Date – Pick Specific Date
|
The day of the year and time at which the outage is to start. |
Start Date – Random Date |
You can allow HOMER to pick random outage start dates. See Outage Settings and Random Seeds for more information |
“Outage occurs every...” (years)
|
The period in years at which resiliency events should occur. This entry must be greater than or equal to 1. A value of 1 would indicate that the outage occurs every year. |
Dispatch Algorithm has advanced knowledge of this outage |
Selecting this would help in smarter charging of a battery before the outage occurs |
Dispatch Algorithm has advanced knowledge of this outage

This option is available in the Resilience and the Reliability menus. This determines whether the dispatch can know about the outage in advance. If you select this option the dispatch can make sure the battery is fully charged before the outage occurs. This can be more realistic in some cases: if you are modeling a outages associated with a hurricane, we usually would have plenty of warning time to charge up the battery. This option won't make any difference for systems that don't have a battery.
The "advanced knowledge" option is not compatible with the "battery outage reserve" option.
With advanced knowledge selected, the dispatch picks demand limits with knowledge of the outages. With the battery outage reserve option, HOMER picks demand limits without knowledge of the outages, but picks them such that a fraction of the battery isn't used for peak shaving. The dispatch can't do both of these strategies at the same time.
Sample Resilience Calculation
Homer Grid allows you to enter a multi-day outage and the frequency with which this outage occurs. For example, a 10 day outage that occurs every 5 years. Let us assume that the project lifetime is 25 years. It would make a big difference in the economics of the system if this 10 day outage occurred in this sequence (year 0, 5,10,15,20,25) versus this sequence ( year 2, 7, 12, 17,22). To keep it simple, Homer Grid models 2 years: 1 year with No Outage and 1 year with the outage. So in the above example, HOMER Grid would model 1 year with no outage, and another year with 10-day outage. When you calculate results in HOMER Grid, it runs the normal simulations and optimizations modeled with no outages, plus it performs an extra simulation with the outage period that you specify for each system design. HOMER calculates the operating costs for the “no-outage” simulation and for the “with-outage” simulation and computes the cash flows as a weighted average depending on the probability of the resilience outage happening in any given year (one divided by the value specified for the “Outage occurs every…”).
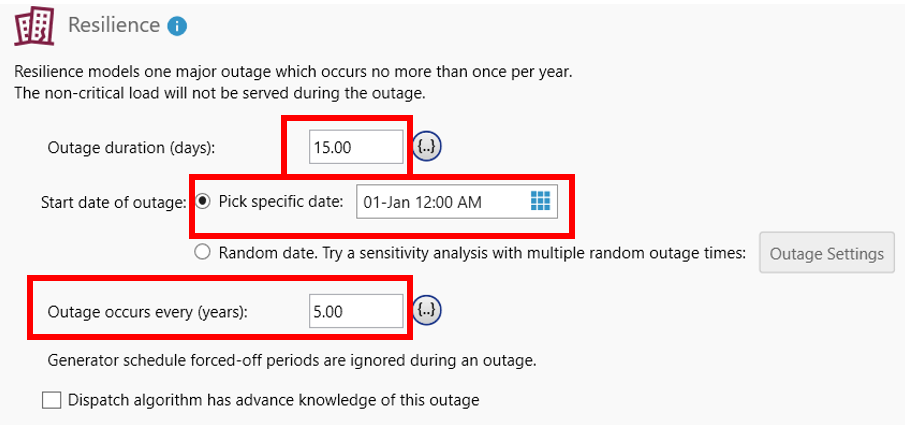
Let us calculate the weighted average fuel cost for a model with a Resilience outage. This example shows an outage that occurs every 2 years and lasts 15 days when it occurs. Every time this outage occurs, it begins on January 1st. You can see the below screen-shot of the outage.
Let us make the Project Lifetime as 3 years for this project. For this model, HOMER would do the following steps to calculate the system costs over project lifetime.
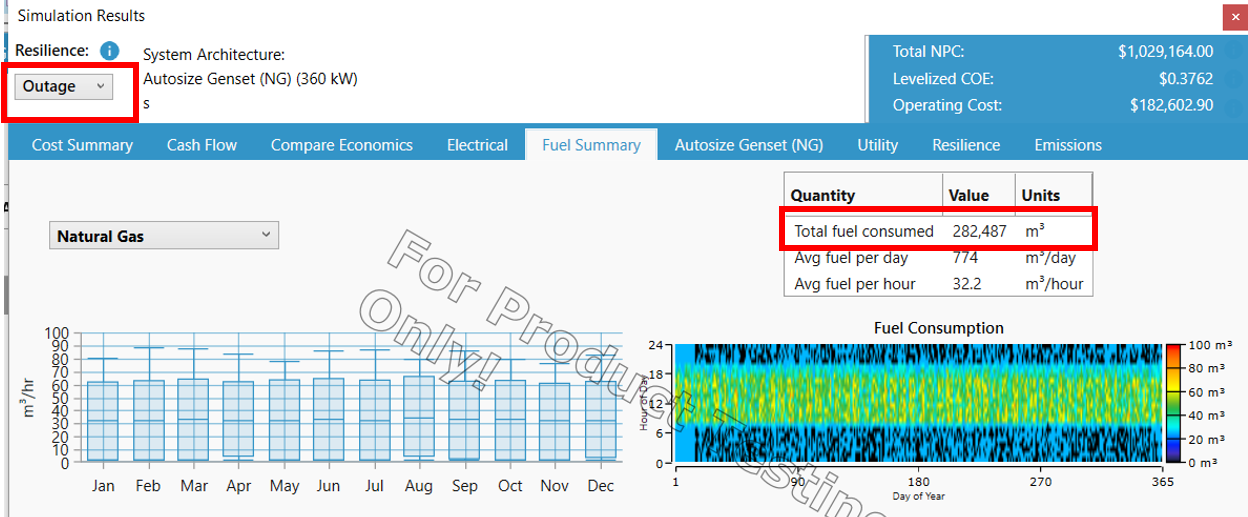
Step 1: HOMER would simulate 1 year with the outage event (so during this year the grid would be down for 15 days starting January 1st). It would then calculate the costs incurred during this year – Generator costs, utility bill etc. You can calculate the Fuel cost by selecting the “Outage” option in the detailed results under Fuel Summary Tab, and multiplying the total fuel consumed with the fuel price. (Shown in screenshot below) Let us denote the fuel cost during this year as Coutage= 282,487 m3*0.3 $/m3= 84746.1 $
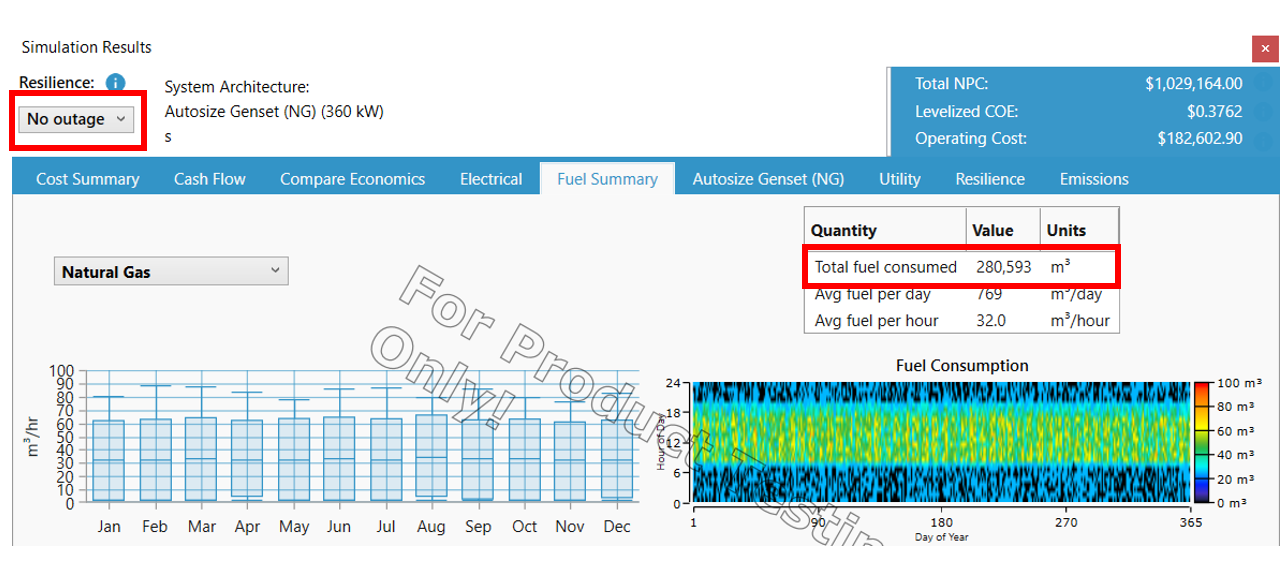
Step 2: HOMER would simulate 1 year without the outage event (so during this year the grid would be available starting January 1st). It would then calculate the costs incurred during this year – Generator costs, utility bill etc. You can calculate this Fuel cost by selecting the “No Outage” option in the detailed results under Fuel Summary Tab, and multiplying the total fuel consumed with the fuel price. (see screenshot below) Let us denote the fuel cost during this year as CNo_Outage= 280,593 m3*0.3 $/m3=84177.9 $
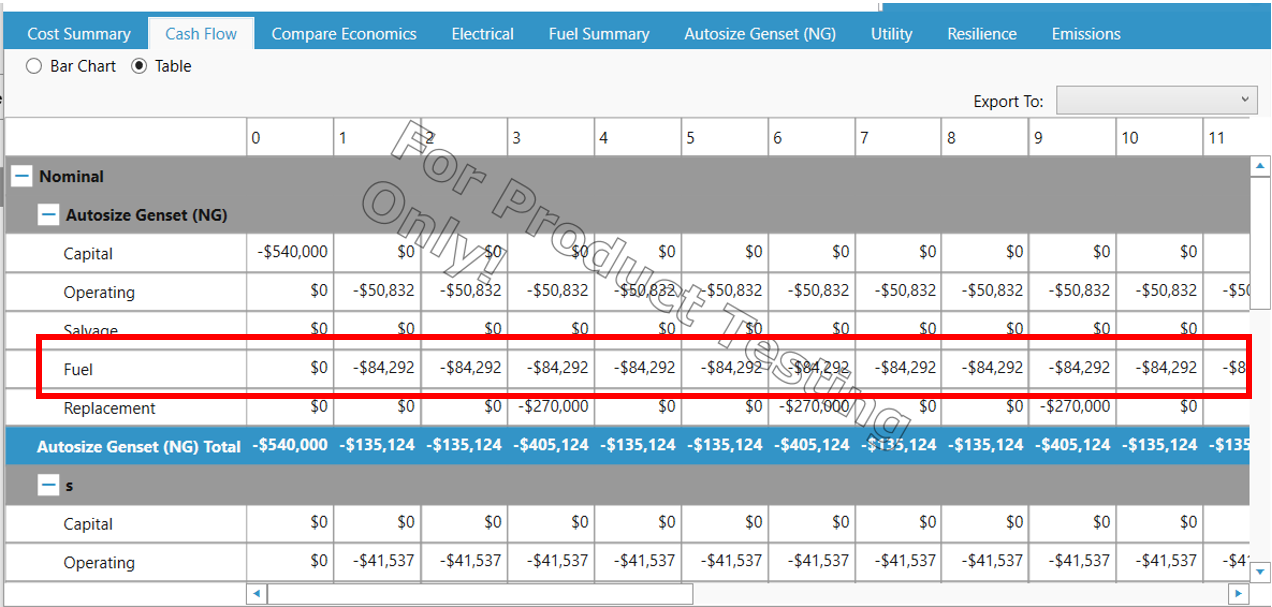
Step 3: Since we had mentioned that the outage occurs every 5 years, the weighted average cost of fuel = 1/5 (Coutage )+ 4/5 (CNo_Outage) = 1/5(84746) + 4/5(84177.9) = 16949.2 + 67342.32 = 84291.52 $
This is the number you will see for Generator fuel cost in the cashflow.
See also
