
HOMER Pro 3.16

After you create an electric, thermal, or hydrogen load using one of the methods in the Adding a Load section of the help, the Electric, Thermal, or Hydrogen Load page appears, respectively. You can return to this page by clicking on the corresponding load icon in the system Schematic or under the Load tab in the toolbar.
The Load profile page displays a graphic representation of the load profile and presents summary statistics for the data. You can modify some details of the load on this page.
Hourly Data
You can modify the daily profile, hour-by-hour in the table on the left side of the page.
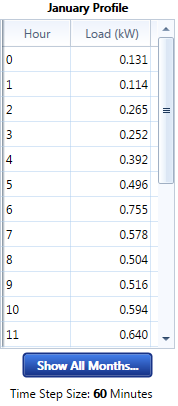
Click Show All Months... to set a different daily profile for weekends and weekdays and for each month of the year.
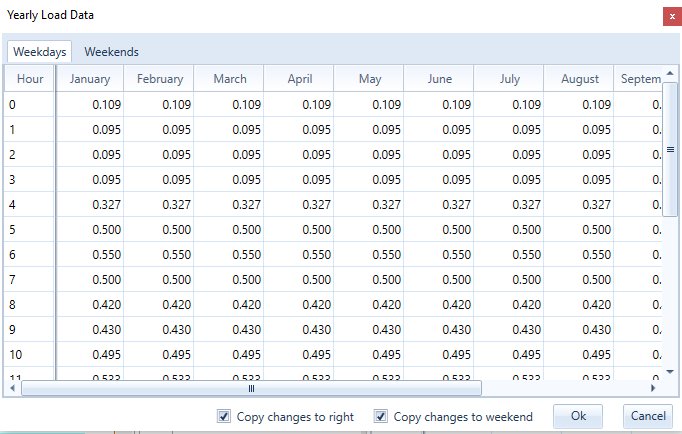
If you select Copy Changes to Right, any value you enter is copied across all remaining months. For example, if you enter "10" for January, hour 0, all months, hour 0, are set to 10. If you then enter "9" for hour 0 in February, January stays set to 10 and February through December are set to 9. You can edit values for weekends or weekdays by selecting the respective tab at the top of the table. Changes made to the profile for weekends do not affect the profile for weekdays, and vice versa.
Year to Model
Set this to the year that you want to simulate. Data that can have different weekday/weekend behavior, such as loads, schedules, and tariffs, are shifted to match the modeled year. When multi-year is enabled, this is the first year and successive years are incremented and shifted to appropriately.
This can be disabled or enabled in Project > Optimization.
Scaled Data for Simulation
HOMER uses scaled data for calculations. To create scaled data, HOMER multiplies each of the baseline data values by a common factor that results in an annual average value equal to the value that you specify in Scaled Annual Average.
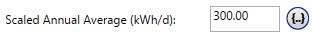
To determine the value of this factor, HOMER divides the scaled annual average by the baseline annual average. The scaled data retains the shape and statistical characteristics of the baseline data, but may differ in magnitude. The default value for the scaled annual average is the baseline annual average. When the two values are equal, the scaled data and baseline are identical.
Note: The average load is reported in kWh/day but the peak load is reported in kW.
Two reasons to use a scaled annual average that is different from the baseline annual average are for unit conversion (e.g., to convert from W to kW) or to perform a sensitivity analysis on the size of the thermal load. Click the Sensitivities button (to the right of the text box) to enter multiple values for a sensitivity analysis.
The Export button allows you to export the scaled data to a text file.
Click the Plot button at the bottom of the page to see a Time Series Detail Analysis.
Other Options
You can set additional options on the Load Profile page, as described in the table below.
Variable |
Description |
Sets the daily or hourly variability used in synthesizing artificial data. |
|
Load Type |
Select whether the load is alternating current (AC) or direct current (DC) |
Check this box to calculate cost-effectiveness of efficiency measures. The inputs below are enabled when the box is checked. (For Electric Load only) * |
|
Efficiency multiplier |
The factor by which this primary load is multiplied if the efficiency package is implemented. (Enter 0.80 for a 20% reduction in load.) * |
Capital cost ($) |
The cost of implementing efficiency measures, in $. * |
Lifetime (yr) |
The lifetime of efficiency measures, in years. * |
*This input requires the Advanced Load module. See Adding Modules for more information on purchasing these modules.
See also
