
HOMER Pro 3.16

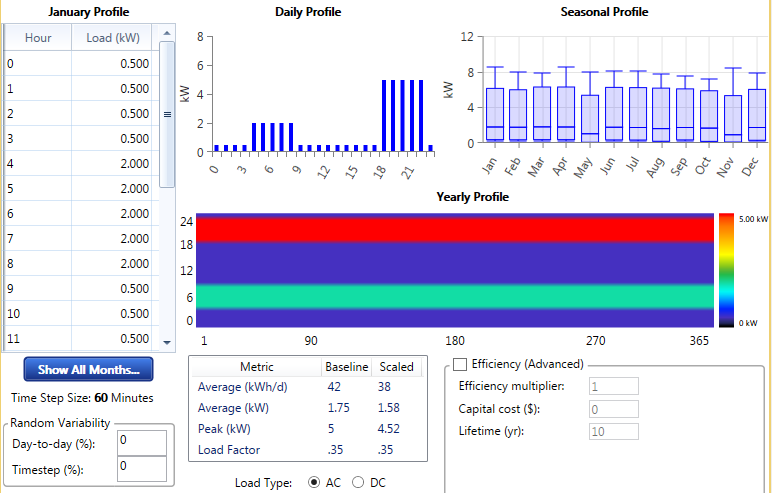
The Random Variability inputs on the Electric, Thermal, and Hydrogen Load pages allow you to add randomness to the load data to make it more realistic. The Random variability inputs are Day-to-day and Timestep. If you import time-series load data, these inputs are listed for reference but are not be editable. If you are generating synthetic load with HOMER, you can change these values.
To see the effect that each type of variability has on the load data, consider the following average load profile.
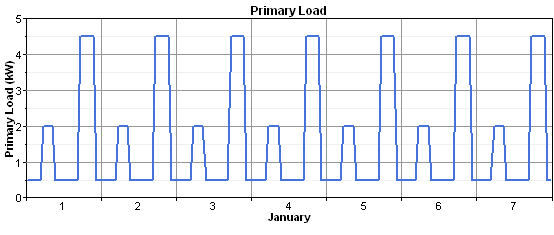
The following graph shows the load data without any added variability. A plot of the first week of the year shows that the load profile repeats itself day after day.
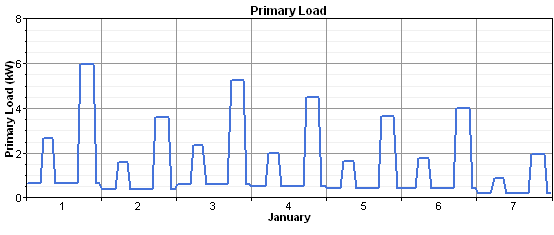
Realistically, however, the size and shape of the load profile varies from day to day. Adding variability can make the load data more realistic. As an example, if you add 20% day-to-day variability, HOMER changes each day's load profile by a random amount, so the load retains the same shape for each day, but is scaled upward or downward. The first week of the year is shown below.
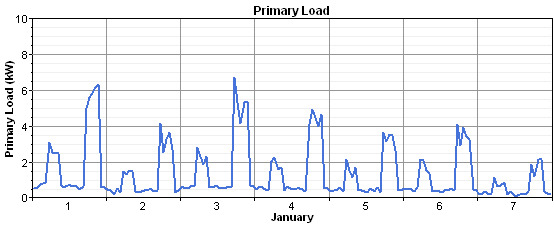
As an example of time-step-to-time-step variability, reset the day-to-day variability to zero and add 15% time-step-to-time-step variability. This variability changes the shape of the load profile without affecting its size. The following is a plot of the first week of the year.
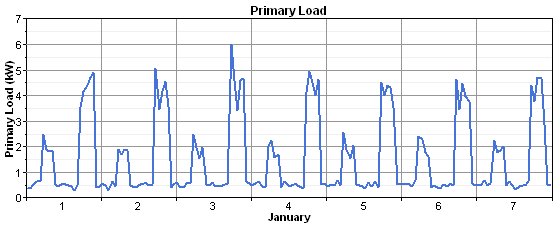
By combining day-to-day and time-step-to-time-step variability, you can create realistic-looking load data. The following is a plot of the first week of the year with 20% day-to-day variability and 15% time-step-to-time-step variability.
The mechanism for adding day-to-day and time-step-to-time-step variability is simple. First, HOMER assembles the year-long array of load data from the daily profiles you specify. Then, it steps through that time series, and, in each time step, it multiplies the value in that time step by a perturbation factor α:
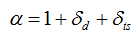
where: |
|
|
|
δd |
= daily perturbation value |
|
δts |
= time step perturbation value |
HOMER randomly draws the daily perturbation value once per day from a normal distribution with a mean of zero and a standard deviation equal to the daily variability (Day-to-day) input. It randomly draws the time step perturbation value every time step from a normal distribution with a mean of zero and a standard deviation equal to the time-step-to-time-step variability (Timestep) input value.
See also
