
HOMER Pro 3.16

The Optimal System Type plot is the highest-level view of the sensitivity results. It shows the lowest-cost type of system (e.g., diesel-storage or wind-diesel-storage) and two sensitivity variables. You can select which variable is the x-axis and which is the y-axis from the Sensitivity Variables drop-down menus. You can also select a variable to superimpose from the drop-down menu under Variables to Plot.
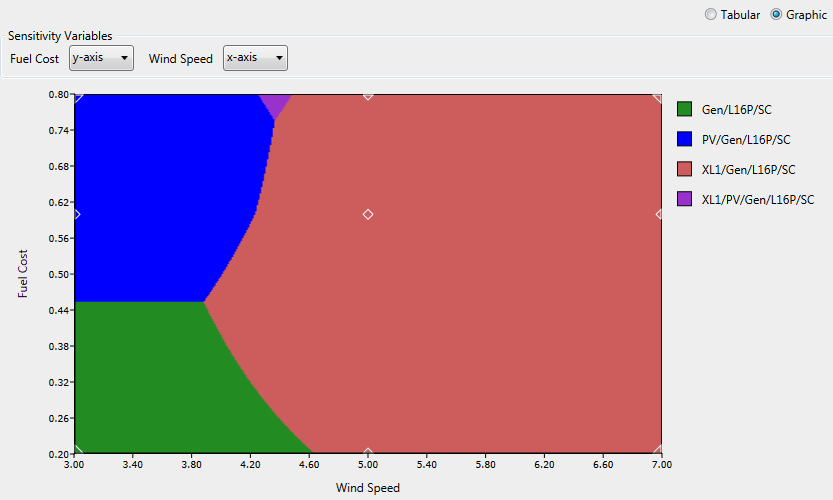
The example below shows the same information as in the Tabular display above. The Graphical format makes it easier to see under which conditions the different types of systems are optimal. Diamonds indicate points where HOMER found the least-cost system. All other points are colored using interpolation.
To save the plot, right-click the plot and click Export as PNG. In the pop-up window, navigate to the location where you want to save the file. Enter a file name. Click Save.
To view or change properties; such as title, labels, resolution, and drawing mode; right-click the plot. Click Properties. In the pop-up window, make your changes in the boxes or select them from the drop-down menu. Click OK.
See also
