HOMER Pro 3.16

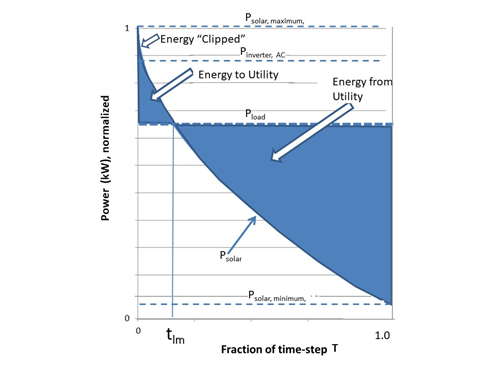
The Intra-Timestep Distribution dispatch strategy uses a National Renewable Energy Lab (NREL) algorithm to consider effects of solar variability at a finer resolution than the simulation time step. This dispatch strategy approximates inverter clipping, or energy in excess of inverter capacity, and grid sales within the time step to better estimate the economics that can be achieved by the system.
Note: 1.This controller does not work with the grid sale capacity limit and can be used with only AC-connected PV, the grid component, and a load.
2. This controller can only be used with 60-minute time steps. Set 60 minutes per time step in Project Optimization.

The figure above illustrates how often and how much solar output varies from the time step average. As a result of this variance, energy may exceed the inverter capacity (kW) resulting in inverter clipping or grid sale losses. This function is an estimate of the variability of the solar resources data within the time step and does not synthesize higher resolution data from lower resolution data (15 minute data from hourly data).
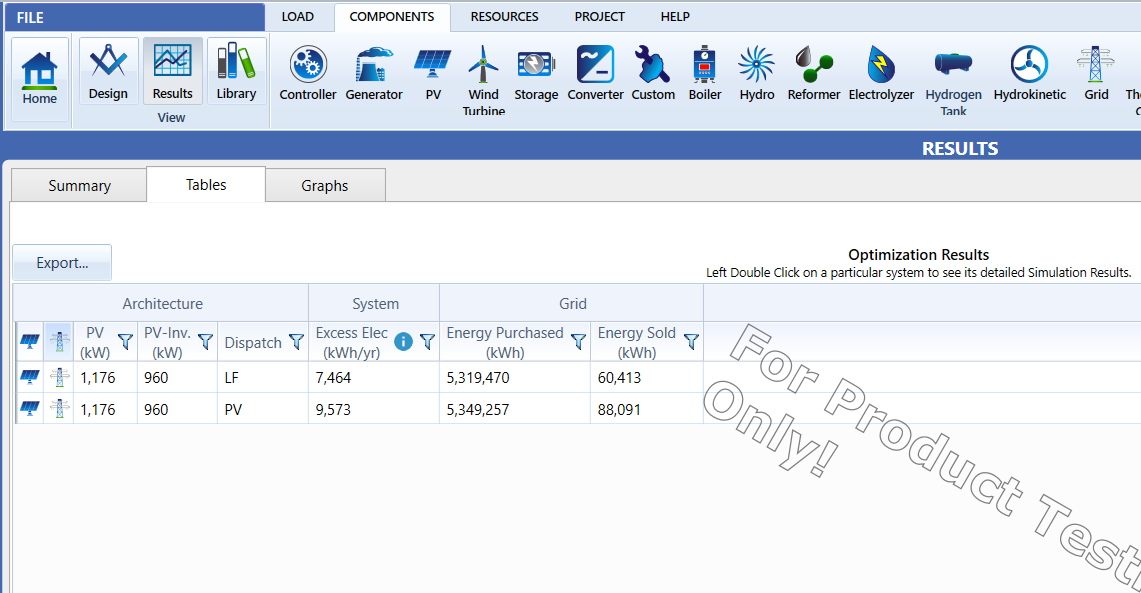
The example provided below shows how the Intra-Timestep Distribution Controller may change the results of your simulation within HOMER Pro.
The Intra-Timestep Distribution Controller is abbreviated to "PV " in tables on the results page.

Example: Rooftop PV System in Washington DC, 1,176 kW PV; 960 kW inverter; 800 kW load
|
Load Following |
Intra-Timestep Distribution |
% Difference |
|---|---|---|---|
Total PV Energy (kWh/year) |
1,756,407 |
1,756,407 |
0.0% |
PV Energy Clipped (kWh/year) |
7,464 |
9,573 |
28.3% |
PV Energy to Utility (kWh/year) |
60,413 |
88,091 |
45.8% |
PV Energy Used On-site (kWh/year) |
1,688,530 |
1,658,743 |
-1.8% |
Energy from Utility (kWh/year) |
5,319,470 |
5,349,257 |
0.6% |
See Also
