
HOMER Pro 3.16

The new and improved reports feature (released in HOMER 3.9) allows you to create your own report by allowing you to choose the sections of the result you want in your report. To access the Reports Settings, click the Results button in the toolbar. Double-click a row in the Optimization Results table. The Simulation Results pop-up window opens. At the bottom left corner of the window, click the Report button (highlighted in red box).
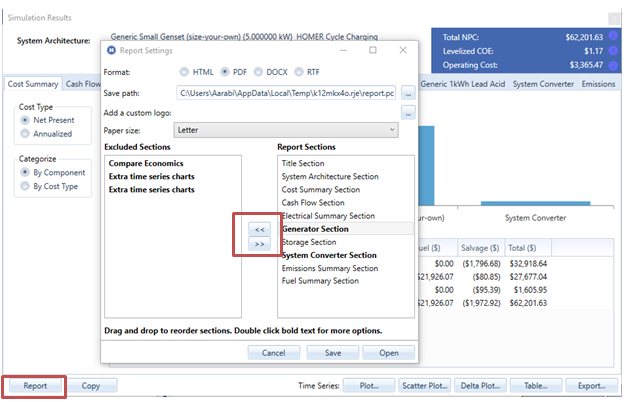
To customize your report:
1.Choose the format for the report by clicking the HTML, PDF, DOCX, or RTF radio button.
2.Enter the path where you want to save your output report or click the ... button and navigate to the location.
Note: You must be a licensed Homer Pro user to add a custom logo to a report.
3.Select the Paper size from the drop-down menu.
4.You can choose the sections you want to include in your report.
•Highlight sections in the Excluded Sections list on the left that you want to include in the report and click the double right arrows. The sections move to the Report Sections list on the right.
•To remove sections from the report, highlight them in the Report Sections and click the double left arrows to move them to the Excluded Sections list on the left.
•Drag and drop items to move them between the lists.
5.For sections that are bold in either list, double-click the entry to access additional options. In the pop-up window, check the boxes for the graphs you want to include in the report. The following example shows the options for the Generator Section.
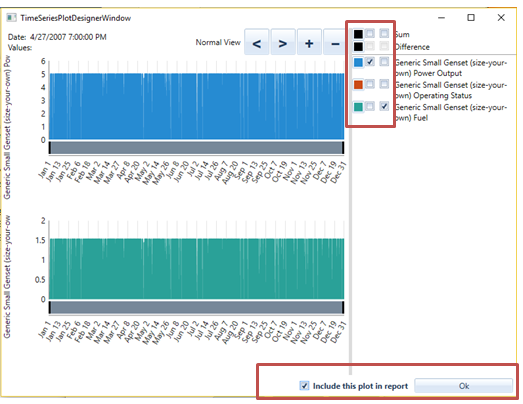
6.Check the Include plot in report box on the bottom and click OK.
7.On the Report Settings window, click:
•Open to open a copy of the report right away.
•Save to save it for viewing later.
