
HOMER Grid 1.10

Refer to this Demand Response article to learn more about how demand response works.
How HOMER Grid decides the bid limit in the case of Optimize Bid
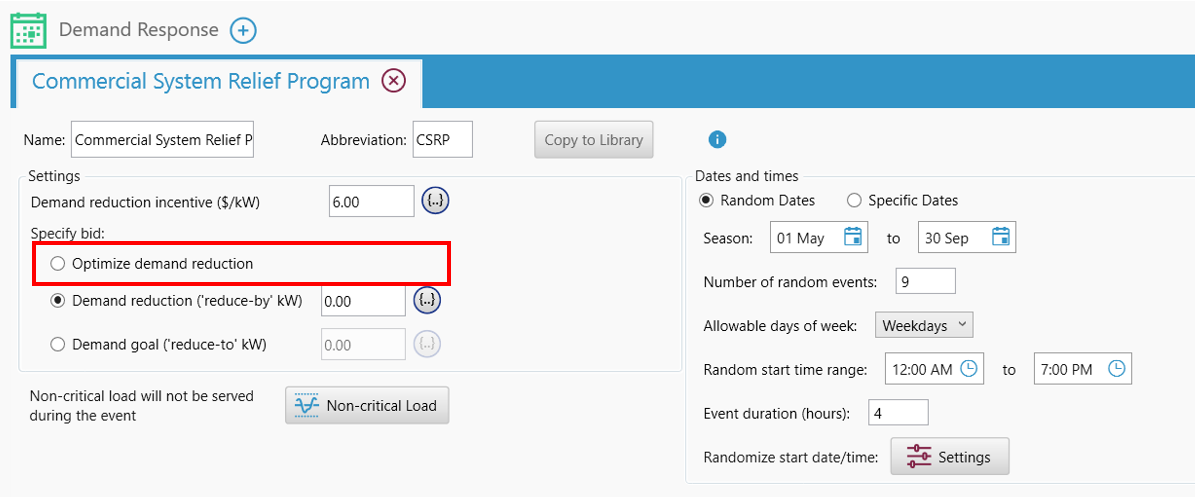
Similarly to how HOMER Grid calculates the demand limit for demand charges, it creates a separate demand limit for each Demand Response event. It then performs a series of optimizations, each simultaneously optimizing the Demand Limit for demand charges and the Demand Limit for one DR event. These optimizations will attempt to reduce the overall costs.
Demand Limits for demand charges are calculated for each month, so only DR events in the same month affect the same Demand Limit for demand charges. If multiple DR events fall within a single month, the events are optimized chronologically, with previous Demand Limits held fixed while the Demand Limit for the next DR event is optimized along with the Demand Limit for demand charges. Once all DR events in the month are processed, the Demand Limit for demand charges is optimized one final time while keeping the Demand Limits for the DR events fixed.
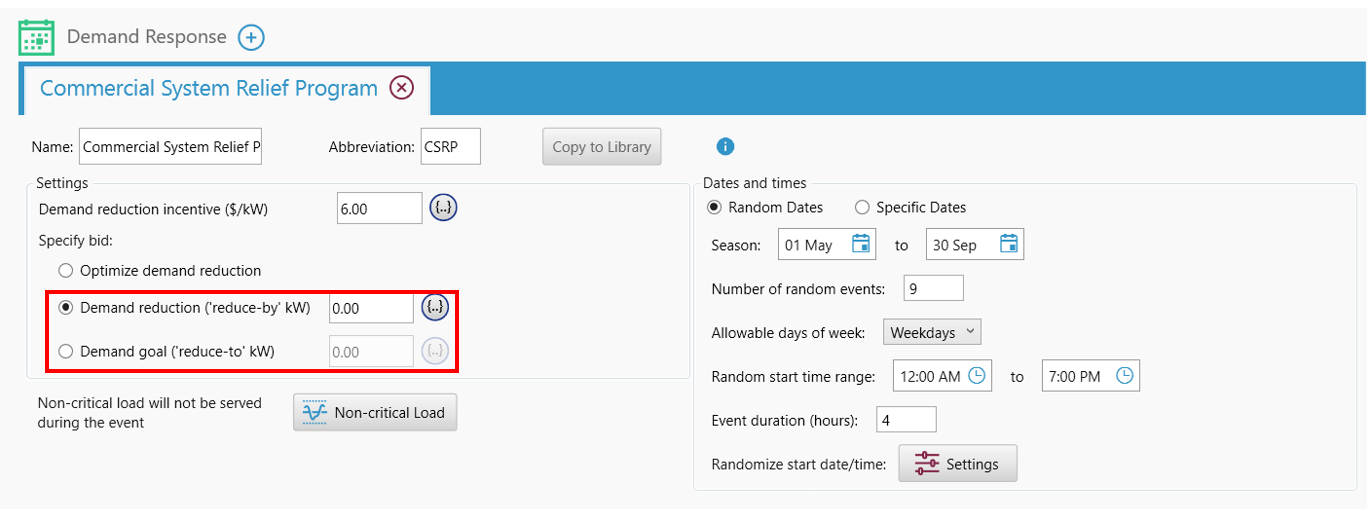
Note: If you specify a bid limit (either reduce by or reduce to), HOMER Grid does not optimize. If it is unable to meet your bid then the simulation is declared infeasible.
How HOMER considers the tradeoff of Demand Charge Reduction versus Demand Reduction incentive
While HOMER Grid dispatch performs its iterative numerical optimization, it tests a wide range of combinations to find the optimal costs. It looks at the tradeoff in savings from reducing demand charges versus savings from minimizing grid purchases during a demand response event.
Let us consider an example where the monthly demand charge is 30 $/kW and the Demand Response incentive is $30 for every kW reduced. Let us assume there are five Demand Response events in the month. If we reduced the monthly peak demand by 100 kW throughout the month, then the total savings by demand charge reduction is = 30 * 100 = $3000. However, if we reduced 100 kW during each of the five Demand Response events, then the total savings by demand response is = 30 * 100 * 5 = $15000.
See also
