
HOMER Pro 3.16

The two-parameter Weibull distribution is often used to characterize wind regimes because it has been found to provide a good fit with measured wind data. The probability density function is given by the following equation:
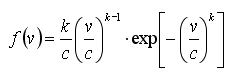
where: |
|
|
|
v |
= the wind speed [m/s] |
|
k |
= the Weibull shape factor [unitless] |
|
c |
= the Weibull scale parameter [m/s] |
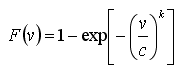
The cumulative distribution function is given by the following equation:
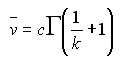
The following equation relates the two Weibull parameters and the average wind speed:
where: |
|
|
|
Γ |
= the gamma function |
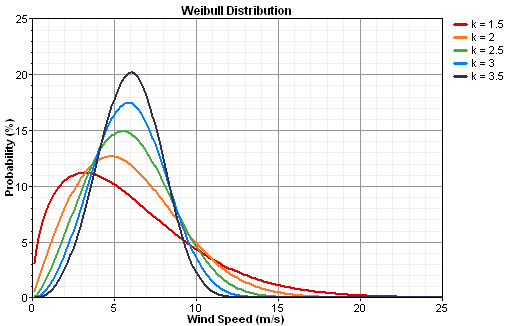
One can describe a Weibull distribution using an average wind speed and a Weibull k value. The graph below shows five Weibull distributions, all with the same average wind speed of 6 m/s, but each with a different Weibull k value. As the graph shows, lower k values correspond to broader distributions.
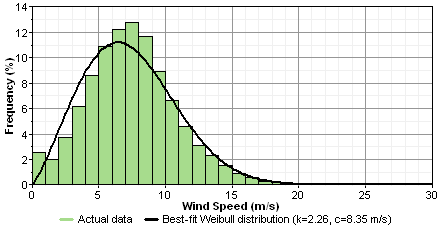
To fit a Weibull distribution to measured wind data, HOMER uses the maximum likelihood method given by Stevens and Smulders, 1979. The graph below shows a typical distribution of wind speeds and the best-fit Weibull distribution.
See also
