
HOMER Pro 3.16

![]()
Click the Temperature button under the Resources tab in the toolbar at the top of the page. The Temperature Resource page appears.
You can specify the ambient temperature for the year with regard to the PV and Wind Components. Enter twelve monthly numbers or import a time-series data file. If you enter a scaled average different from the average of the baseline data, HOMER offsets the temperature data to correspond to the average value that you enter.
HOMER uses the ambient temperature to calculate the PV cell temperature, as described in the How HOMER calculates the PV cell temperature section of the help. HOMER uses a Temperature Resource when modeling a Wind Turbine Component if the "Consider ambient temperature data" box is checked on the Component page.
The Plot button allows you to view the scaled data in several graphical formats.
Choose a Data Source
The baseline data is a time series representing the average temperature for each time step of the year. HOMER displays the monthly averages in the Monthly Average Temperature Data table and graph.
There are two ways to create baseline data: you can use HOMER to synthesize hourly data from monthly averages, or you can import time-series radiation data from a file.
Click either the Enter monthly averages radio button or the Import from a time series data file or the library radio button.
Monthly Averages
You can enter temperature resource data in the Monthly Average Temperature Data table manually or by downloading it from the HOMER website.
To download solar data from HOMER Software, first be sure that you have selected your project's location on the Home page. Then, click the Download button to automatically fill in the twelve monthly average values based on the latitude and longitude.
After there are values in the monthly table, HOMER builds a set of 8,760 temperature values, or one for each hour of the year. HOMER assumes a constant temperature throughout the month, and writes a time series where the temperature in each month is constant at the average value. This is a simplifying assumption; for a more precise representation of ambient temperature, you can import time-series data from a file.
Import Temperature Data
You can prepare your own text file containing the temperature in each time step for a year.
Tip: You can import data with time steps of many sizes between 60 minutes and one minute. HOMER detects the time step when you import the data file. For example, if the data file contains 8760 lines, HOMER assumes it contains hourly data. If the data file contains 52,560 lines, HOMER assumes it contains 10-minute data.
The data file must contain a single value on each line, corresponding to one time step. Each value in the file represents the temperature (°C) for that time step. The first time step starts at midnight on January 1st. The following is a sample input file.
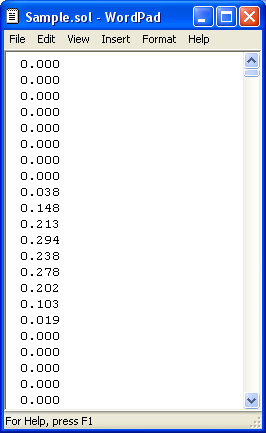
Click the Import button to open the text file. You can import a text file with any extension.
When you import data from a text file, HOMER makes a copy of the data set and integrates it with the HOMER (.homer) file. After the data is part of the HOMER file, HOMER no longer refers to the original text file. If you modify data in the original file, you must import the modified file in order for the modification to be included in the HOMER file. After you import a data file, HOMER calculates monthly average values and displays them in the table and graph. HOMER also displays the name of the imported data file in the title of the graph.
Scaled Data for Simulation
HOMER uses scaled data for calculations. To create scaled data, HOMER multiplies each of the values in the baseline data by a common factor that results in an annual average value equal to the value that you specify in the Scaled Annual Average box.
To determine the value of this factor, HOMER divides the Scaled Annual Average by the baseline annual average. The scaled data retains the shape and statistical characteristics of the baseline data, but may differ in magnitude. The default value for the Scaled Annual Average is the baseline annual average. When the two values are equal, the scaled data and baseline are identical.
Two reasons to use a different Scaled Annual Average than the baseline annual average are for unit conversion and sensitivity analysis.
An example of using the Scaled Annual Average for unit conversion is to convert data from an imported file that contains temperature expressed in °F rather than °C. If the baseline annual average is 59°F, enter 15 in the Scaled Annual Average box, so the scaled data is equivalent to the baseline data, but expressed in °C: °F = 9/5 * (°C) + 32.
See also
