
HOMER Pro 3.16

The Cash Flow tab in the Simulation Results window displays the system cash flow in either graphical or tabular form. You can choose the form by clicking the Bar Chart or Table radio buttons at the top of the window. Both views are described below.
Bar Chart
Each bar in the graph represents either a total inflow or total outflow of cash for a single year. The first bar, for year zero, shows the capital cost of the system, which also appears in the Optimization Results. A negative value represents an outflow, or expenditure for fuel, equipment replacements, or operation and maintenance (O&M). A positive value represents an inflow, which may be income from electricity sales or the salvage value of equipment at the end of the project lifetime.
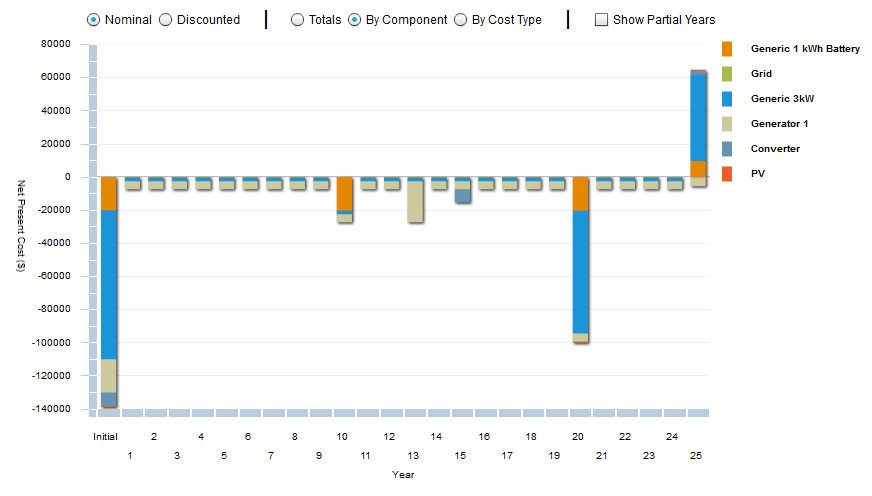
You can choose to display the cash flows as either Nominal or Discounted values. A nominal cash flow is the actual income minus cost that HOMER anticipates in a particular year. A discounted cash flow is the nominal cash flow discounted to year zero. HOMER calculates the discounted cash flow by multiplying the nominal cash flow by the discount factor.
You can choose among two options for displaying the cash flow graph:
•By Cost Type shows each cash flow as a stacked bar, with each color representing one of five cost types: capital, replacement, salvage, O&M, and fuel. The salvage value appears as a positive value at the end of the project lifetime. For grid-connected systems that sell electricity to the grid, grid sales are included in the O&M cost type.
•By Component displays each cash flow as a stacked bar, with a different color representing each of the components in the system. Penalties and system fixed costs appear in the graph as "other" costs.
Pivot Table
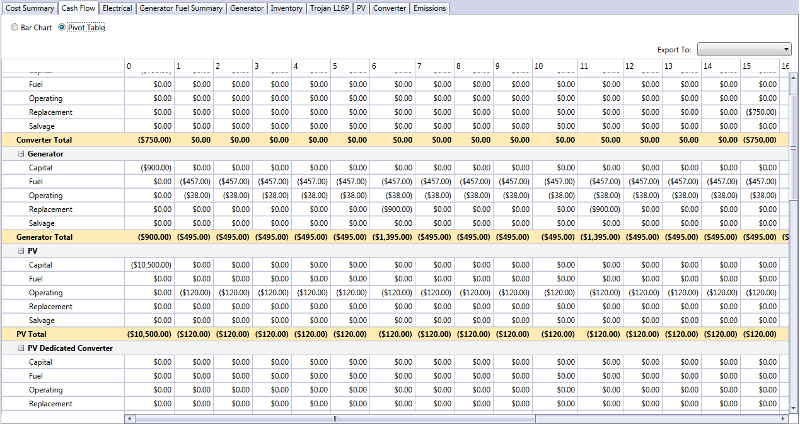
Choose the Table radio button under the Cash Flow tab. The cash flow details table shows a detailed breakdown of all the costs that occur throughout the project lifetime.
The image below shows an example of the cash flow details table. Each year of the project lifetime appears as a column. The rows list the capital cost, replacement cost, salvage value, O&M cost, fuel cost, and total cost for each component. Nominal costs appear in the top half of the table, and discounted costs appear in the bottom half. The discount factors, which HOMER uses to calculate discounted costs from nominal costs, appear in between.
Tip: Using the controls at the top of the window, you can choose to display a breakdown of the costs by component or by cost type, or to display nominal or discounted costs.
The example above shows the cash flows for a system comprised of a diesel generator and a wind turbine. The project lifetime is ten years. The diesel generator needs to be replaced at a cost of $5,500 every two years, and the wind turbine needs to be replaced at a cost of $12,000 every eight years.
Capital Costs
Capital costs occur only at the beginning of the project, meaning at the end of year zero. No capital costs occur after year zero.
Replacement Costs
Replacement costs occur whenever a Component needs a replacement. Replacement costs may not necessarily occur at integer year numbers. For example, if a generator requires replacement every 3.25 years, HOMER assigns replacement costs at 3.25 years, 6.5 years, and so on. Use the controls at the top of the window if you want to see the precise timing of these cash flows.
Salvage Value
Salvage value occurs as a positive cash flow at the end of the project lifetime for any component that has some remaining life at that point. As an example, if a wind turbine requires replacement after eight years, and if the second wind turbine is only two years old at the end of the ten-year project lifetime, it has six years remaining in its lifetime. HOMER assumes linear depreciation, so it calculates a salvage value of 6/8 = 75% of the replacement cost of the wind turbine. Because the wind turbine replacement cost is $12,000, the salvage value of the wind turbine is $9,000 at the end of the project lifetime.
The Salvage value may also include any prorated maintenance costs as an additional cost at the end of the project lifetime. For example, if a generator has a 40,000-hour maintenance procedure with a cost of $40,000 and the generator operates for 50,000 hours during the life of the project, $10,000 will be included in the salvage value.
Operating and Maintenance Costs
For many components, such as the PV array and the wind turbine, you enter the O&M costs in dollars per year. For other components, such as the generator, you enter the O&M cost in dollars per operating hour. HOMER multiplies that number by the operating hours per year to calculate the resulting annual O&M cost in dollars per year. The number HOMER reports for the grid O&M cost is actually the annual cost of buying power from the grid minus the annual revenue gained from sales of power to the grid.
Fuel Costs
For components that consume fuel, HOMER calculates the annual fuel cost by multiplying the fuel price by the annual fuel consumption.
Tip: When displaying discounted costs, the bottom row of the table shows the total discounted cost for each year of the project lifetime. The sum of these numbers, which appears in the bottom right corner of the table, equals the total net present cost of the system.
See also
