
HOMER Pro 3.16

The annualized cost of a component is the cost that, if it were to occur equally in every year of the project lifetime, would give the same net present cost as the actual cash flow sequence associated with that component.
HOMER calculates annualized cost by first calculating the net present cost, then multiplying it by the capital recovery factor, as in the following equation:

where: |
|
|
|
CNPC |
= the net present cost [$] |
|
i |
= the annual real discount rate [%] |
|
Rproj |
= the project lifetime [yr] |
CRF() |
= a function returning the capital recovery factor |
Example: A wind turbine has an initial capital cost of $165,000, a replacement cost of $95,000, a lifetime of 20 years, and an operation and maintenance (O&M) cost of $5,000/yr . What is its annualized cost over a 25-year project lifetime at an annual real interest rate of 6%?
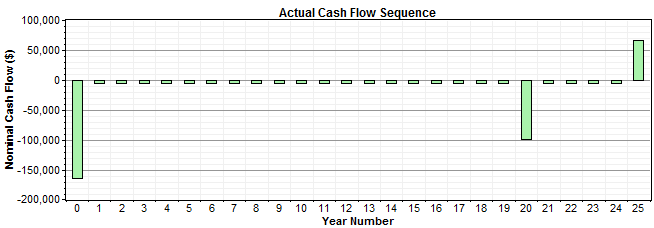
The actual cash flow sequence associated with this wind turbine appears in the graph below. This graph shows the large capital expense in year zero, the small O&M cost that appears in every year, the large replacement cost that occurs after 20 years, and the salvage value that occurs at the end of the project:
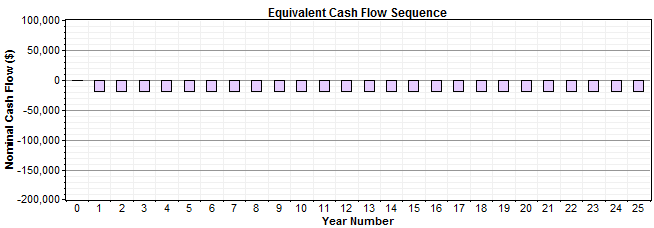
We want to calculate an equivalent cash flow sequence, meaning one that gives the same net present cost, in which a single cost occurs in every year of the project. That single cost is the annualized cost, and the equivalent cash flow sequence would look like the one that appears below:
To calculate the net present cost of the wind turbine, we create a cash flow table as shown below. For each year, we calculate the discount factor, the nominal cash flow, and discounted cash flow, which is equal to the nominal cash flow multiplied by the discount factor. The sum of the discounted cash flows is the net present cost of the wind turbine over the project lifetime: $241,938. We multiply this by the capital recovery factor, which for 25 years and 6% is equal to 0.0782, giving an annualized cost of $18,926/yr.
Year |
Discount Factor |
Actual Cash Flows |
|
Nominal |
Discounted |
||
0 |
1.000 |
-165,000 |
-165,000 |
1 |
0.943 |
-5,000 |
-4,717 |
2 |
0.890 |
-5,000 |
-4,450 |
3 |
0.840 |
-5,000 |
-4,198 |
4 |
0.792 |
-5,000 |
-3,960 |
5 |
0.747 |
-5,000 |
-3,736 |
6 |
0.705 |
-5,000 |
-3,525 |
7 |
0.665 |
-5,000 |
-3,325 |
8 |
0.627 |
-5,000 |
-3,137 |
9 |
0.592 |
-5,000 |
-2,959 |
10 |
0.558 |
-5,000 |
-2,792 |
11 |
0.527 |
-5,000 |
-2,634 |
12 |
0.497 |
-5,000 |
-2,485 |
13 |
0.469 |
-5,000 |
-2,344 |
14 |
0.442 |
-5,000 |
-2,212 |
15 |
0.417 |
-5,000 |
-2,086 |
16 |
0.394 |
-5,000 |
-1,968 |
17 |
0.371 |
-5,000 |
-1,857 |
18 |
0.350 |
-5,000 |
-1,752 |
19 |
0.331 |
-5,000 |
-1,653 |
20 |
0.312 |
-100,000 |
-31,181 |
21 |
0.294 |
-5,000 |
-1,471 |
22 |
0.278 |
-5,000 |
-1,388 |
23 |
0.262 |
-5,000 |
-1,309 |
24 |
0.247 |
-5,000 |
-1,235 |
25 |
0.233 |
66,250 |
15,436 |
Total |
|
|
-241,938 |
To check our work, we can create a cash flow table for this equivalent cash flow sequence, and verify that it gives the same net present cost. The table below shows that the equivalent cash flow does indeed lead to the correct net present cost.
Year |
Discount Factor |
Equivalent Cash Flows |
|
Nominal |
Discounted |
||
0 |
1.000 |
0 |
0 |
1 |
0.943 |
-18,926 |
-17,855 |
2 |
0.890 |
-18,926 |
-16,844 |
3 |
0.840 |
-18,926 |
-15,891 |
4 |
0.792 |
-18,926 |
-14,991 |
5 |
0.747 |
-18,926 |
-14,143 |
6 |
0.705 |
-18,926 |
-13,342 |
7 |
0.665 |
-18,926 |
-12,587 |
8 |
0.627 |
-18,926 |
-11,874 |
9 |
0.592 |
-18,926 |
-11,202 |
10 |
0.558 |
-18,926 |
-10,568 |
11 |
0.527 |
-18,926 |
-9,970 |
12 |
0.497 |
-18,926 |
-9,406 |
13 |
0.469 |
-18,926 |
-8,873 |
14 |
0.442 |
-18,926 |
-8,371 |
15 |
0.417 |
-18,926 |
-7,897 |
16 |
0.394 |
-18,926 |
-7,450 |
17 |
0.371 |
-18,926 |
-7,028 |
18 |
0.350 |
-18,926 |
-6,631 |
19 |
0.331 |
-18,926 |
-6,255 |
20 |
0.312 |
-18,926 |
-5,901 |
21 |
0.294 |
-18,926 |
-5,567 |
22 |
0.278 |
-18,926 |
-5,252 |
23 |
0.262 |
-18,926 |
-4,955 |
24 |
0.247 |
-18,926 |
-4,674 |
25 |
0.233 |
-18,926 |
-4,410 |
Total |
|
|
-241,937 |
The annualized cost serves as a useful metric for comparing the costs of different components because it measures their relative contribution to the total net present cost. It allows for a fair cost comparison between components with low capital and high operating costs (such as diesel generators) and those with high capital and low operating costs (such as PV arrays or wind turbines).
The annualized costs of each system component and of the system as a whole appear on the Cost Summary tab of the Simulation Results window.
See also
