
HOMER Pro 3.16

The Cost Summary tab in the Simulation Results window displays cash flows as either a present value or annualized cost, categorized by component or cost type.
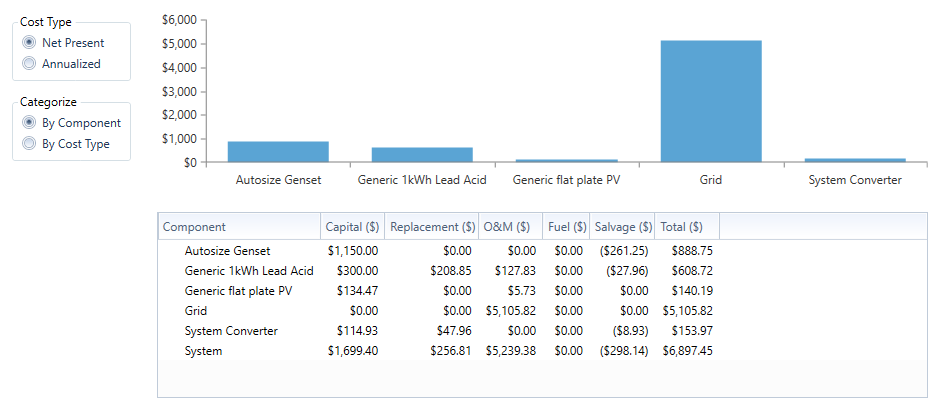
You can choose among several options for displaying the cash flow summary. You can select one of two options for the Cost Type:
•Net Present Cost displays the cost breakdown in terms of net present costs.
•Annualized Cost displays the cost breakdown in terms of annualized costs.
You can select one of two options to Categorize the summary:
•By Component causes HOMER to categorize costs by component.
•By Cost Type causes HOMER to categorize costs according to type: capital, O&M, replacement, resource, and salvage value.
Show details causes HOMER to categorize costs both by component and type in a single graph.
The table below the graph displays the cash flow summary broken down by component and cost type. The values displayed in the graph appear highlighted in the table.
Tip: The Compare Economics tab allows you to compare two systems and calculate payback or internal rate of return.
Tip: For systems connected to the grid, HOMER puts the costs and revenues associated with buying and selling power from the grid into the grid O&M cost.
Note: The total net present cost appears on the Cost Summary tab and in the top right corner of the Simulation Results window.
See also
