
HOMER Grid 1.10

The seasonal profile plot is a box and whisker plot of the monthly minimums, maximums, and averages.
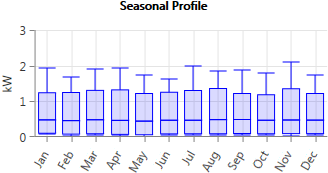
For each month, the top line corresponds to that month's overall maximum. The bottom line corresponds to the overall minimum. The top of the blue box is the average of the daily maximums of all of the days in the month, and the bottom of the box is the average daily minimum. The middle line is the overall average for the whole month.
See also:
