HOMER Grid 1.10

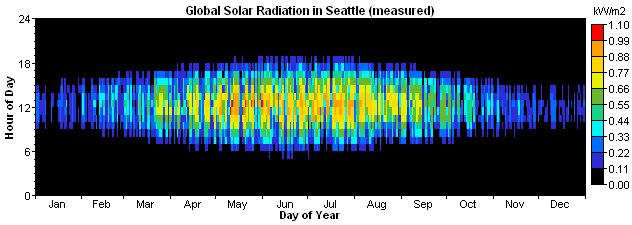
A data map (DMap) is a type of graph showing one year of time series data. With time of day on one axis and day of the year on the other, each time step of the year is represented by a rectangle which is colored according to the data value for that hour. The DMap format often allows you to see daily and seasonal patterns more easily than you could with a simple time series plot. The DMap below shows solar radiation over a year.