
HOMER Pro 3.16

Type: |
Input Variable |
Units: |
%/°C |
Symbol: |
αP |
The photovoltaic (PV) temperature coefficient of power indicates how strongly the PV array power output depends on the cell temperature, meaning the surface temperature of the PV array. It is a negative number because power output decreases with increasing cell temperature. Manufacturers of PV modules usually provide this coefficient in their product brochures, often labeled either as temperature coefficient of power, power temperature coefficient, or max. power temperature coefficient.
In November 2007, we performed a non-exhaustive, non-scientific survey of the product brochures available for some of the commonly available PV modules. The following table contains the average values of the temperature coefficient of power for various types of PV modules in our survey.
PV Module Type |
Modules In Survey |
Modules Reporting αP |
Average Value of αP [%/°C] |
Polycrystalline silicon |
10 |
7 |
-0.48 |
Monocrystalline silicon |
8 |
4 |
-0.46 |
Monocrystalline/amorphous silicon hybrid |
1 |
1 |
-0.30 |
Thin film amorphous silicon |
4 |
4 |
-0.20 |
Thin film CIS |
1 |
1 |
-0.60 |
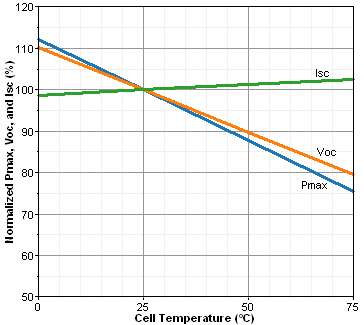
If the product brochure does not specify the value of the temperature coefficient of power, it may contain a graph showing the normalized performance versus cell temperature, as shown below. In such a graph, the slope of the power line (labeled Pmax in this example) is the temperature coefficient of power. The normalized open-circuit voltage and short-circuit current also appear in this sample.
Some product brochures do not specify the temperature coefficient of power, but do specify the temperature coefficient of the open-circuit voltage. In that case, you can calculate the temperature coefficient of power using the approximation suggested by Duffie and Beckman (1991):

where: |
|
|
|
μVoc |
= the temperature coefficient of the open-circuit voltage [V/°C] |
|
Vmp |
= the voltage at the maximum power point under standard test conditions [V] |
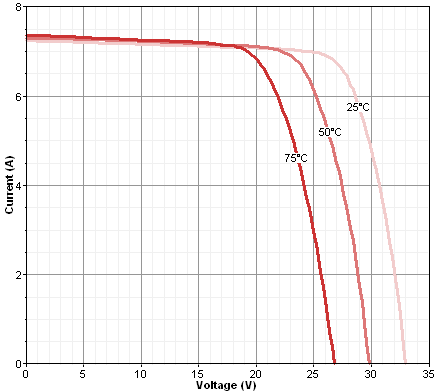
If the brochure does not specify the temperature coefficient of the open-circuit voltage but contains a graph showing the current-voltage (IV) curve at different cell temperatures, as shown below, you can use the graph to calculate the temperature coefficient of the open-circuit voltage.
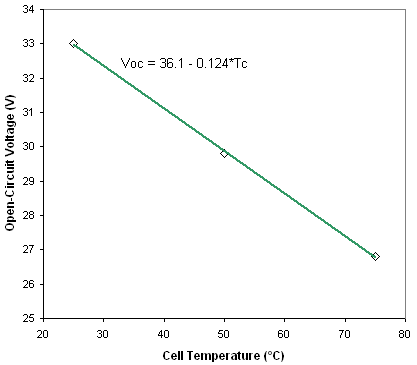
To do so, plot the open-circuit voltage (the voltage at the bottom of the IV curve) versus cell temperature, and find the slope of that line, as shown below. The slope of that line is the temperature coefficient of the open-circuit voltage. In this example, the slope of the line is -0.124 V/°C.
See also:
How HOMER Calculates the PV Cell Temperature
