
HOMER Pro 3.16

The Kinetic Battery Model (Manwell and McGowan, 1993) calculates the amount of energy that can be absorbed by or withdrawn from the storage bank in each time step. It models storage as a two-tank system, to separate the "available energy" for electricity generation and the "bound energy" that cannot be used.
To create a new storage component with the Kinetic Battery Model, start by copying an existing component with that model, like the Generic 1kWh Lead Acid battery.
General
Variable |
Description |
Nominal Voltage |
The rated voltage. It is called nominal because the actual voltage varies according to the storage unit's operating conditions and state of charge. This input is used to convert specifications in A or Ah to values in kW or kWh. |
The round-trip, DC-to-storage-to-DC efficiency of the storage bank. |
|
The relative state of charge below which the storage bank is never drawn. |
|
The storage unit's maximum allowable charge rate, measured in amps per amp-hour of unfilled capacity. |
|
Maximum Charge Current |
The absolute maximum charge current, in amps. |
Maximum Discharge Current |
The absolute maximum discharge current, in amps. |
Storage
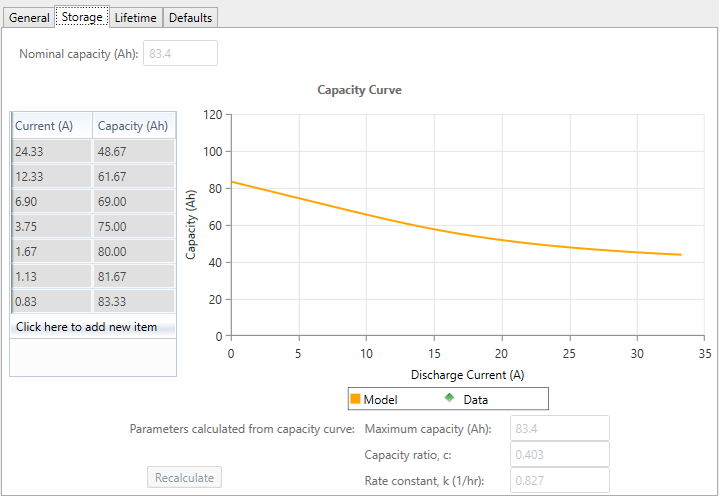
You can define a Kinetic Battery Model by entering points in the capacity table shown above. Click the Recalculate button to have HOMER calculate the parameters of a two-tank system that best fit the data given in the capacity curve. You can also enter the kinetic battery model parameters manually. For detailed information about these parameters and how they are used, see the Kinetic Battery Model section in the help.
Variable |
Description |
Maximum Capacity |
The combined size of the available and bound tanks |
Capacity Ratio |
The ratio of the size of the available tank to the combined size in both the tanks |
Rate Constant |
A measure of how quickly energy can move between the available and bound tanks |
Lifetime
You can choose whether the storage needs replacement after a fixed length of time, or after a fixed quantity of energy cycles through it, or whichever of those two happens first. If you choose to limit the storage life to a certain number of years, enter that number of years as the float life.
If you choose to limit the storage life to a certain quantity of energy throughput, enter that quantity as the lifetime throughput. You can also enter the storage lifetime curve to help calculate this lifetime throughput value.
In a lifetime test, the tester subjects the storage unit to repeated regular charge and discharge cycles. Each cycle, the storage is discharged to a certain depth, then fully charged again. The lifetime test determines how many such cycles the storage can withstand before it needs to be replaced. Manufacturers perform a series of these tests at different depths of discharge to create the storage's lifetime curve.
A lifetime curve shows the number of cycles to failure versus the depth of the cycles, as shown below. Such curves result from the lifetime tests that storage manufacturers typically perform to characterize the longevity of their products.
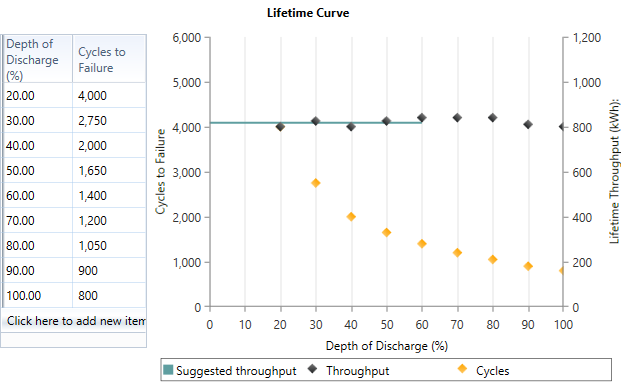
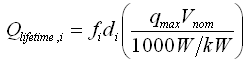
You specify the storage lifetime curve in HOMER as a table of cycles to failure versus depth of discharge. HOMER plots that series of points as yellow diamonds. As in the example above, that plot typically shows a sharp decrease in the number of cycles to failure with increasing depth of discharge. HOMER also plots the lifetime throughput, which it calculates for each point in the lifetime curve using the following equation:
where: |
|
|
|
Qlifetime,i |
= the lifetime throughput [kWh] |
|
fi |
= the number of cycles to failure |
|
di |
= the depth of discharge [%] |
|
qmax |
= the maximum capacity of the storage [Ah] |
|
Vnom |
= the nominal voltage of the storage [V] |
HOMER plots these values as black diamonds on the lifetime curve (using the right-hand y-axis). Their values typically show only a weak dependence on the depth of discharge. HOMER's simulation logic makes the simplifying assumption that the lifetime throughput does not depend on the depth of discharge. The horizontal black line in the lifetime curve shows the calculated value of lifetime throughput. The line is the average of the throughput values calculated for all the points you enter. It is only drawn across the allowable range of depth of discharge.
The calculated lifetime throughput is for reference only; HOMER uses the "Lifetime throughput (kWh)" input near the top of the menu in the simulation. If you want to use the calculated throughput value, be sure to copy it to the "Lifetime throughput (kWh)" input.
