HOMER Pro 3.16

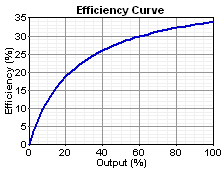
In the Generator Inputs options, when you enter the fuel curve inputs, HOMER draws the corresponding efficiency curve. This section explains how HOMER creates the graph from the fuel curve inputs.
Fuel Units
The units of the fuel curve inputs sometimes change when you select a different fuel from the drop-down menu because, in HOMER, fuels can be denominated in units of kg, L, or m3. When you create a new fuel, you choose which units you want to use for that fuel. For example, you may choose to denominate liquid fuels (e.g., diesel, gasoline, and ethanol) in L, and gaseous fuels (e.g., natural gas, and hydrogen) in m3. After you create a fuel, all the inputs that relate to that fuel use the specified units. For example, if diesel fuel is denominated in L, the price of diesel fuel is in $/L and the fuel curve inputs for a diesel generator are in L/hr/kW. Similarly, if natural gas is denominated in m3, its price is in $/m3 and the fuel curve inputs for a natural gas engine are in m3/hr/kW. This section uses the term "units" to mean the units specified for the particular fuel, whether kg, L, or m3. For example, "units/hr" means L/hr for a fuel denominated in L, and kg/hr for a fuel denominated in kg.
Fuel Curve
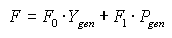
The fuel curve describes the amount of fuel the generator consumes to produce electricity. HOMER assumes that the fuel curve is a straight line. The following equation gives the generator's fuel consumption in units/hr as a function of its electrical output:
where: |
|
|
|
F0 |
= the fuel curve intercept coefficient [units/hr/kW] |
|
F1 |
= the fuel curve slope [units/hr/kW] |
|
Ygen |
= rated capacity of the generator [kW] |
|
Pgen |
= the electrical output of the generator [kW] |
Efficiency Curve
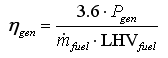
In HOMER, we define the generator's electrical efficiency as the electrical energy coming out divided by the chemical energy of the fuel going in. The following equation gives this relationship:
where: |
|
|
|
Pgen |
= the electrical output [kW] |
|
mfuel |
= the mass flow rate of the fuel [kg/hr] |
|
LHVfuel |
= the lower heating value (a measure of energy content) of the fuel [MJ/kg] |
The factor of 3.6 arises because 1 kWh = 3.6 MJ.
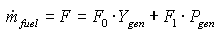
The mass flow rate of the fuel is related to F, the generator's fuel consumption, but the exact relationship depends on the units of the fuel. If the fuel units are kg, then mfuel and F are equal, so the equation for mfuel is as follows:
If the fuel units are L, the relationship between mfuel and F involves the density. The equation for mfuel is as follows:
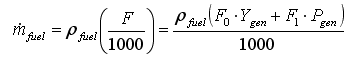
where: |
|
|
|
ρfuel |
= the fuel density [kg/m3] |
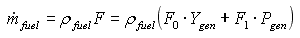
If the fuel units are m3, the factor of 1000 is unnecessary, and the equation for mfuel is as follows:
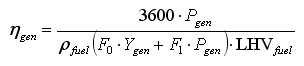
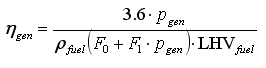
If the fuel units are L, the efficiency equation becomes:
If we divide numerator and denominator by Ygen, the capacity of the generator, and define a new symbol pgen for the relative output of the generator (pgen = Pgen/Ygen) then the efficiency equation becomes:
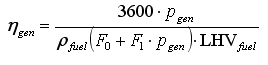
This equation gives the efficiency of the generator as a function of its relative output. HOMER plots this relationship in the efficiency curve in the Generator Inputs window when the fuel units are L.
If the fuel units are m3, the efficiency equation becomes:
Finally, if the fuel units are kg, the efficiency equation becomes:
Example
As an example, you can analyze a 75 kW generator that burns diesel. Assume the diesel has a density of 820 kg/m3 and a lower heating value of 43.2 MJ/kg. The generator consumes 22.5 L/hr at full load and 10.5 L/hr at 25 kW.
First, you calculate the fuel curve slope and intercept coefficient. In HOMER, you must assume that the fuel curve is a straight line passing through the two given points, as shown in the graph below.
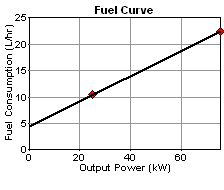
If there are more than two points on this curve, you an calculate the line of best fit, using a linear regression technique, for example. Because you only have two points in this example, you can calculate the slope and intercept of the line that passes through those points.
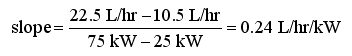
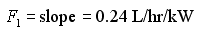
You can find the slope and intercept of that line as follows:

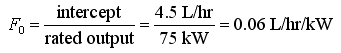
HOMER's first fuel curve input is not the intercept itself, but rather the intercept coefficient, defined as the intercept divided by the rated capacity of the generator. (This is so that HOMER can apply the fuel curve inputs to each generator size that you specify in the Sizes to consider table.) So the two fuel curve inputs are:
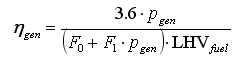
Because this is a liquid fuel denominated in L, the appropriate efficiency equation is:
So you can substitute the values of density, lower heating value, and fuel curve as follows:
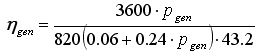
Therefore, the efficiency is 33.9% at full load (pgen= 1), 28.2% at 50% load, 18.8% at 20% load, and 7.0% at 5% load. The efficiency curve is shown below: